Run a shop on gut feel and you learn about a margin-eating discount months late, and a
marketing push is judged on a hunch. This chapter turns your live orders, customers and stock into
plain figures: filter them by date, export them, have them emailed on a schedule, or simply ask a
question in everyday language.
The problem: the honest answer to "how is the shop doing?" lives in
your head and a few scattered spreadsheets, pieced together from memory the night before every
supplier meeting.
Your home for store analytics. Every report sits under the Reports area in the admin
sidebar, opens on its own page, and shows clear tables of figures drawn straight from your live
orders, customers and stock, so you walk into any meeting already knowing the numbers. Most reports
let you pick a date range and download the results.
In practice
Say it is the start of the month and you want a quick health check on the shop before your supplier meeting: how were abaya sales, how many orders came in, and what stock value you are sitting on.
How Angelite handles it: you click Reports in the admin sidebar and see the full list of reports laid out. You open the Sales report, set the date range to last month, and the figures refresh on the page. Each report opens on its own page with a clear table, and you can hop between Sales, Profit and Inventory without leaving the Reports area, all shown in your base currency (QAR) so the numbers line up.
How to use it
Open Reports in the admin sidebar to see the list of available reports.
Click a report (for example Sales) to open it on its own page.
Pick a date range where the report offers one, then apply it to refresh the figures.
Read the table, or use the download control to take the numbers with you.
Where: Reports in the admin sidebar, with each report on its own page.
Good to know: all monetary figures are shown in your store's base
currency, so totals stay comparable even when customers pay in different currencies.
The reports
Basic reports
Admin
The problem: a busy season can feel like a triumph while discounts
quietly eat the margin, and nobody can say what the stock sitting on the shelves is actually
worth.
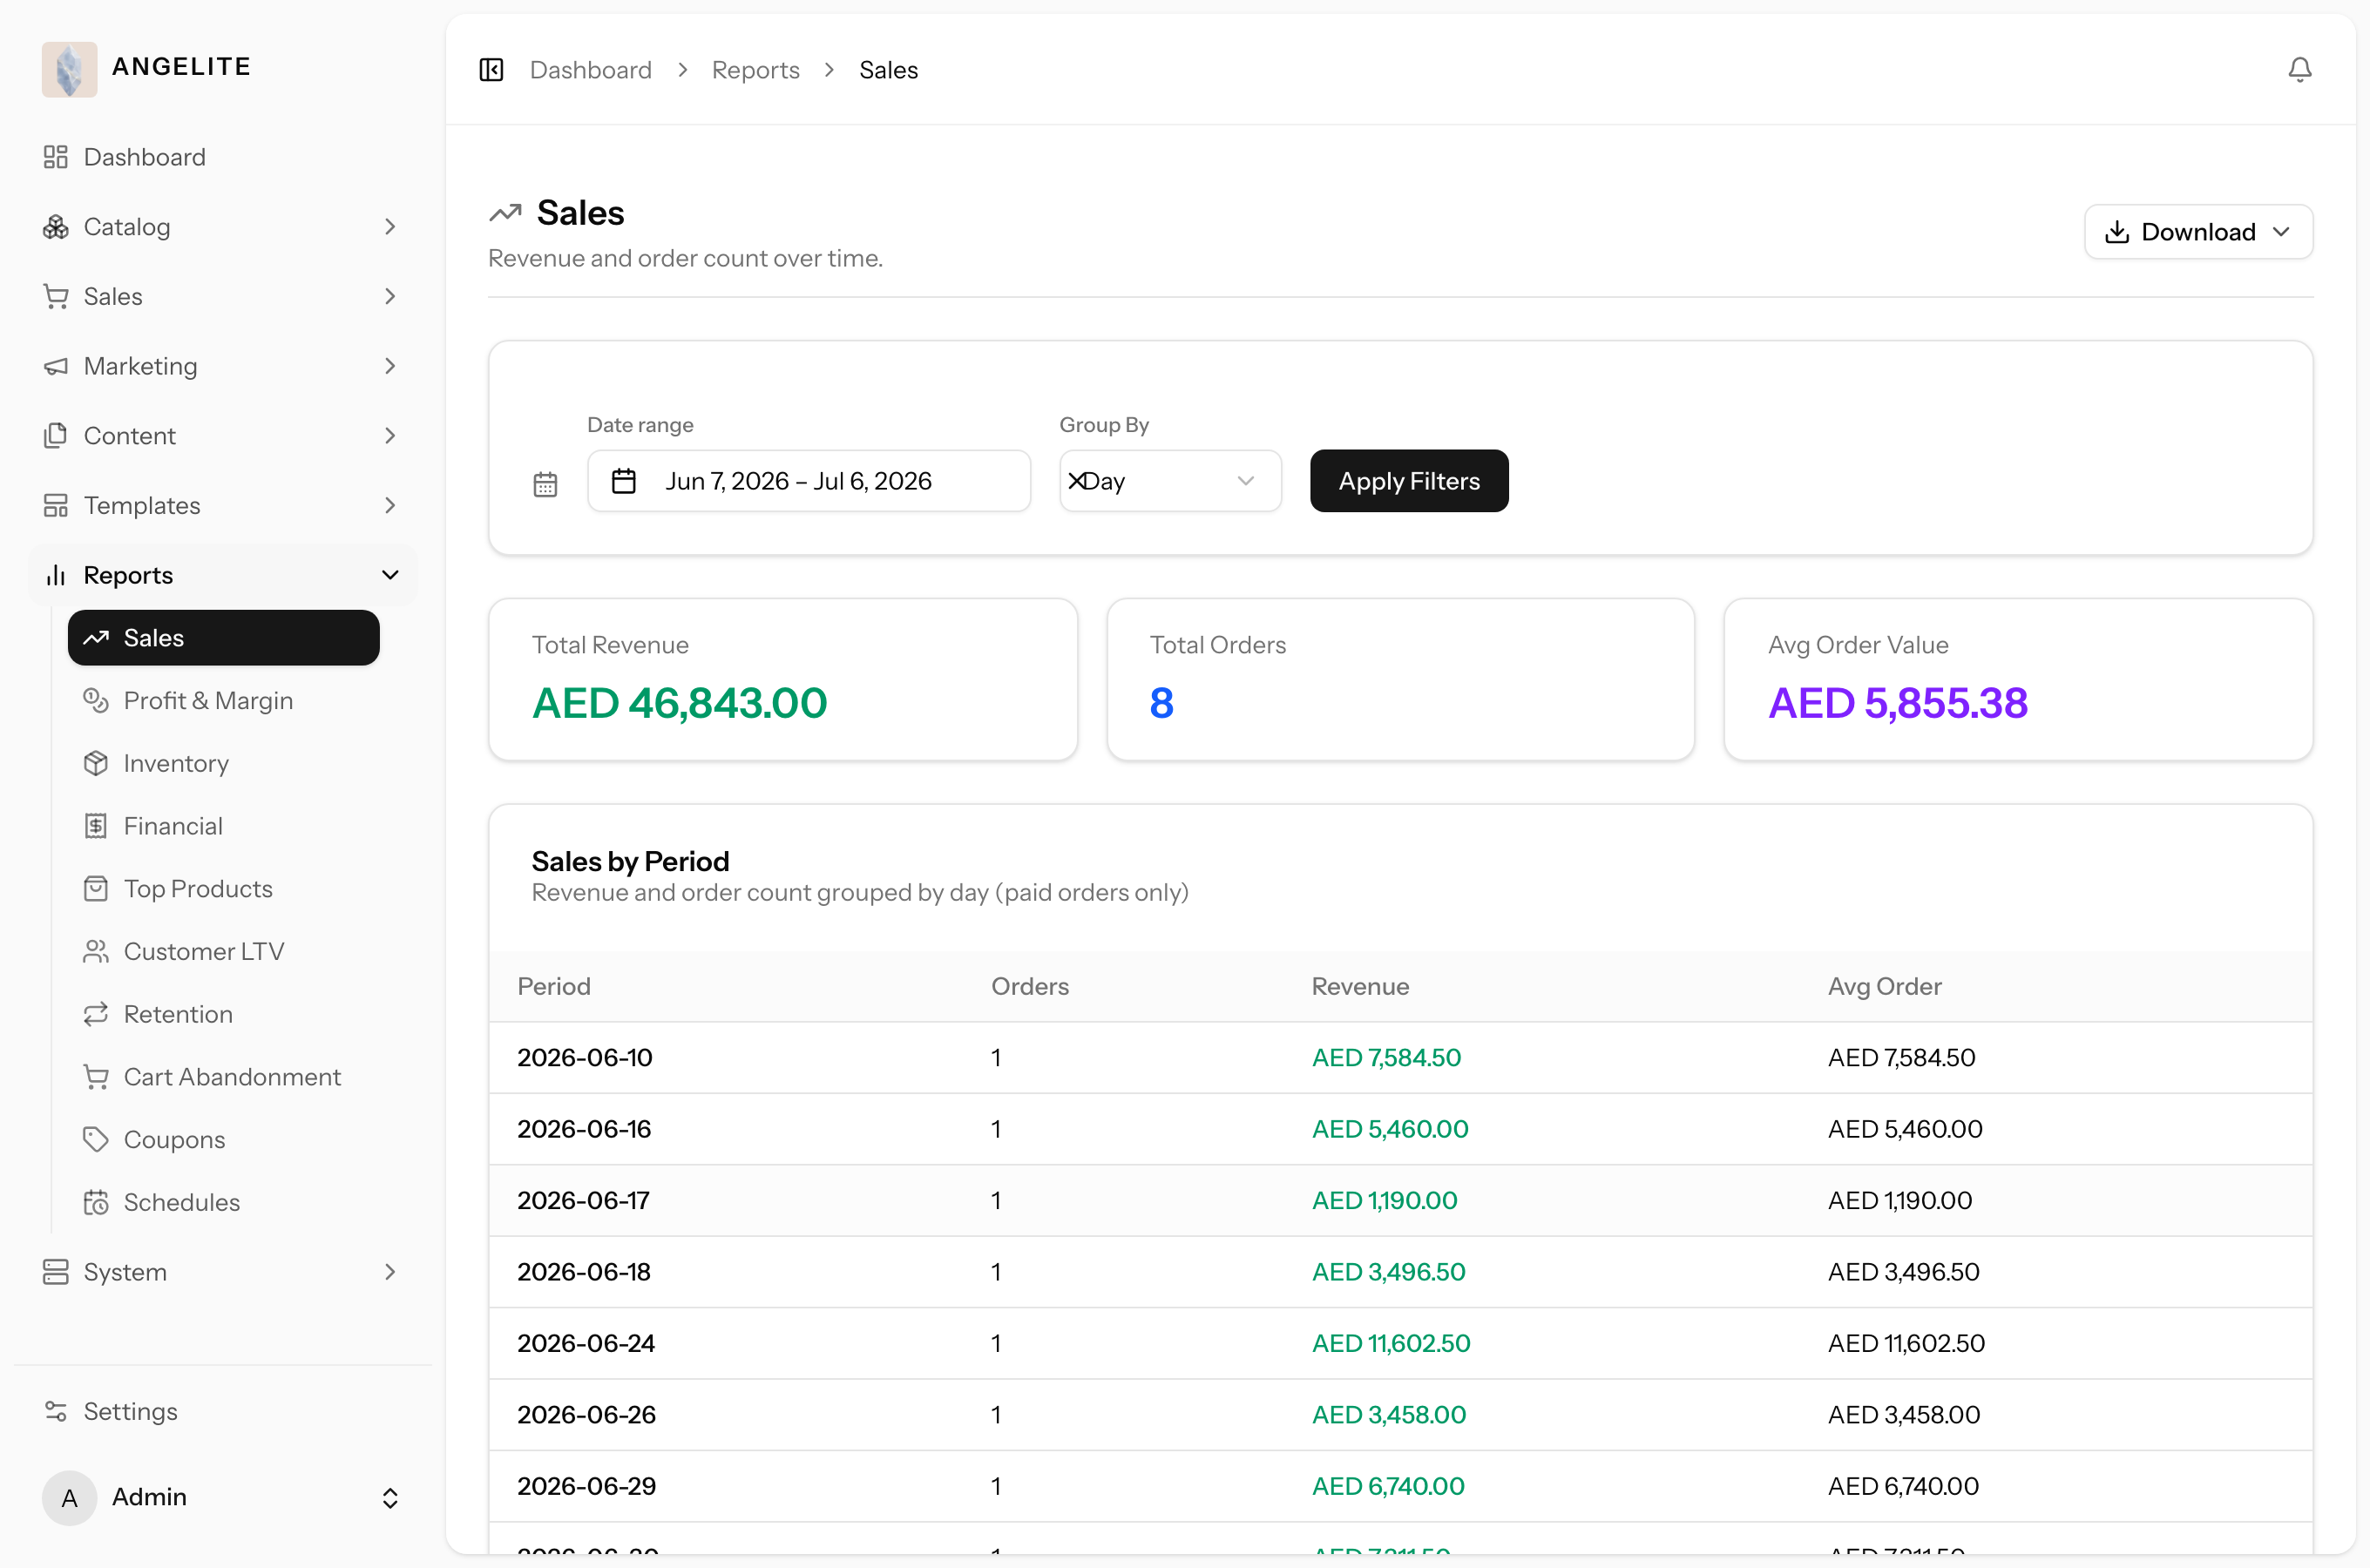
The core three, always available on every store. Sales shows paid
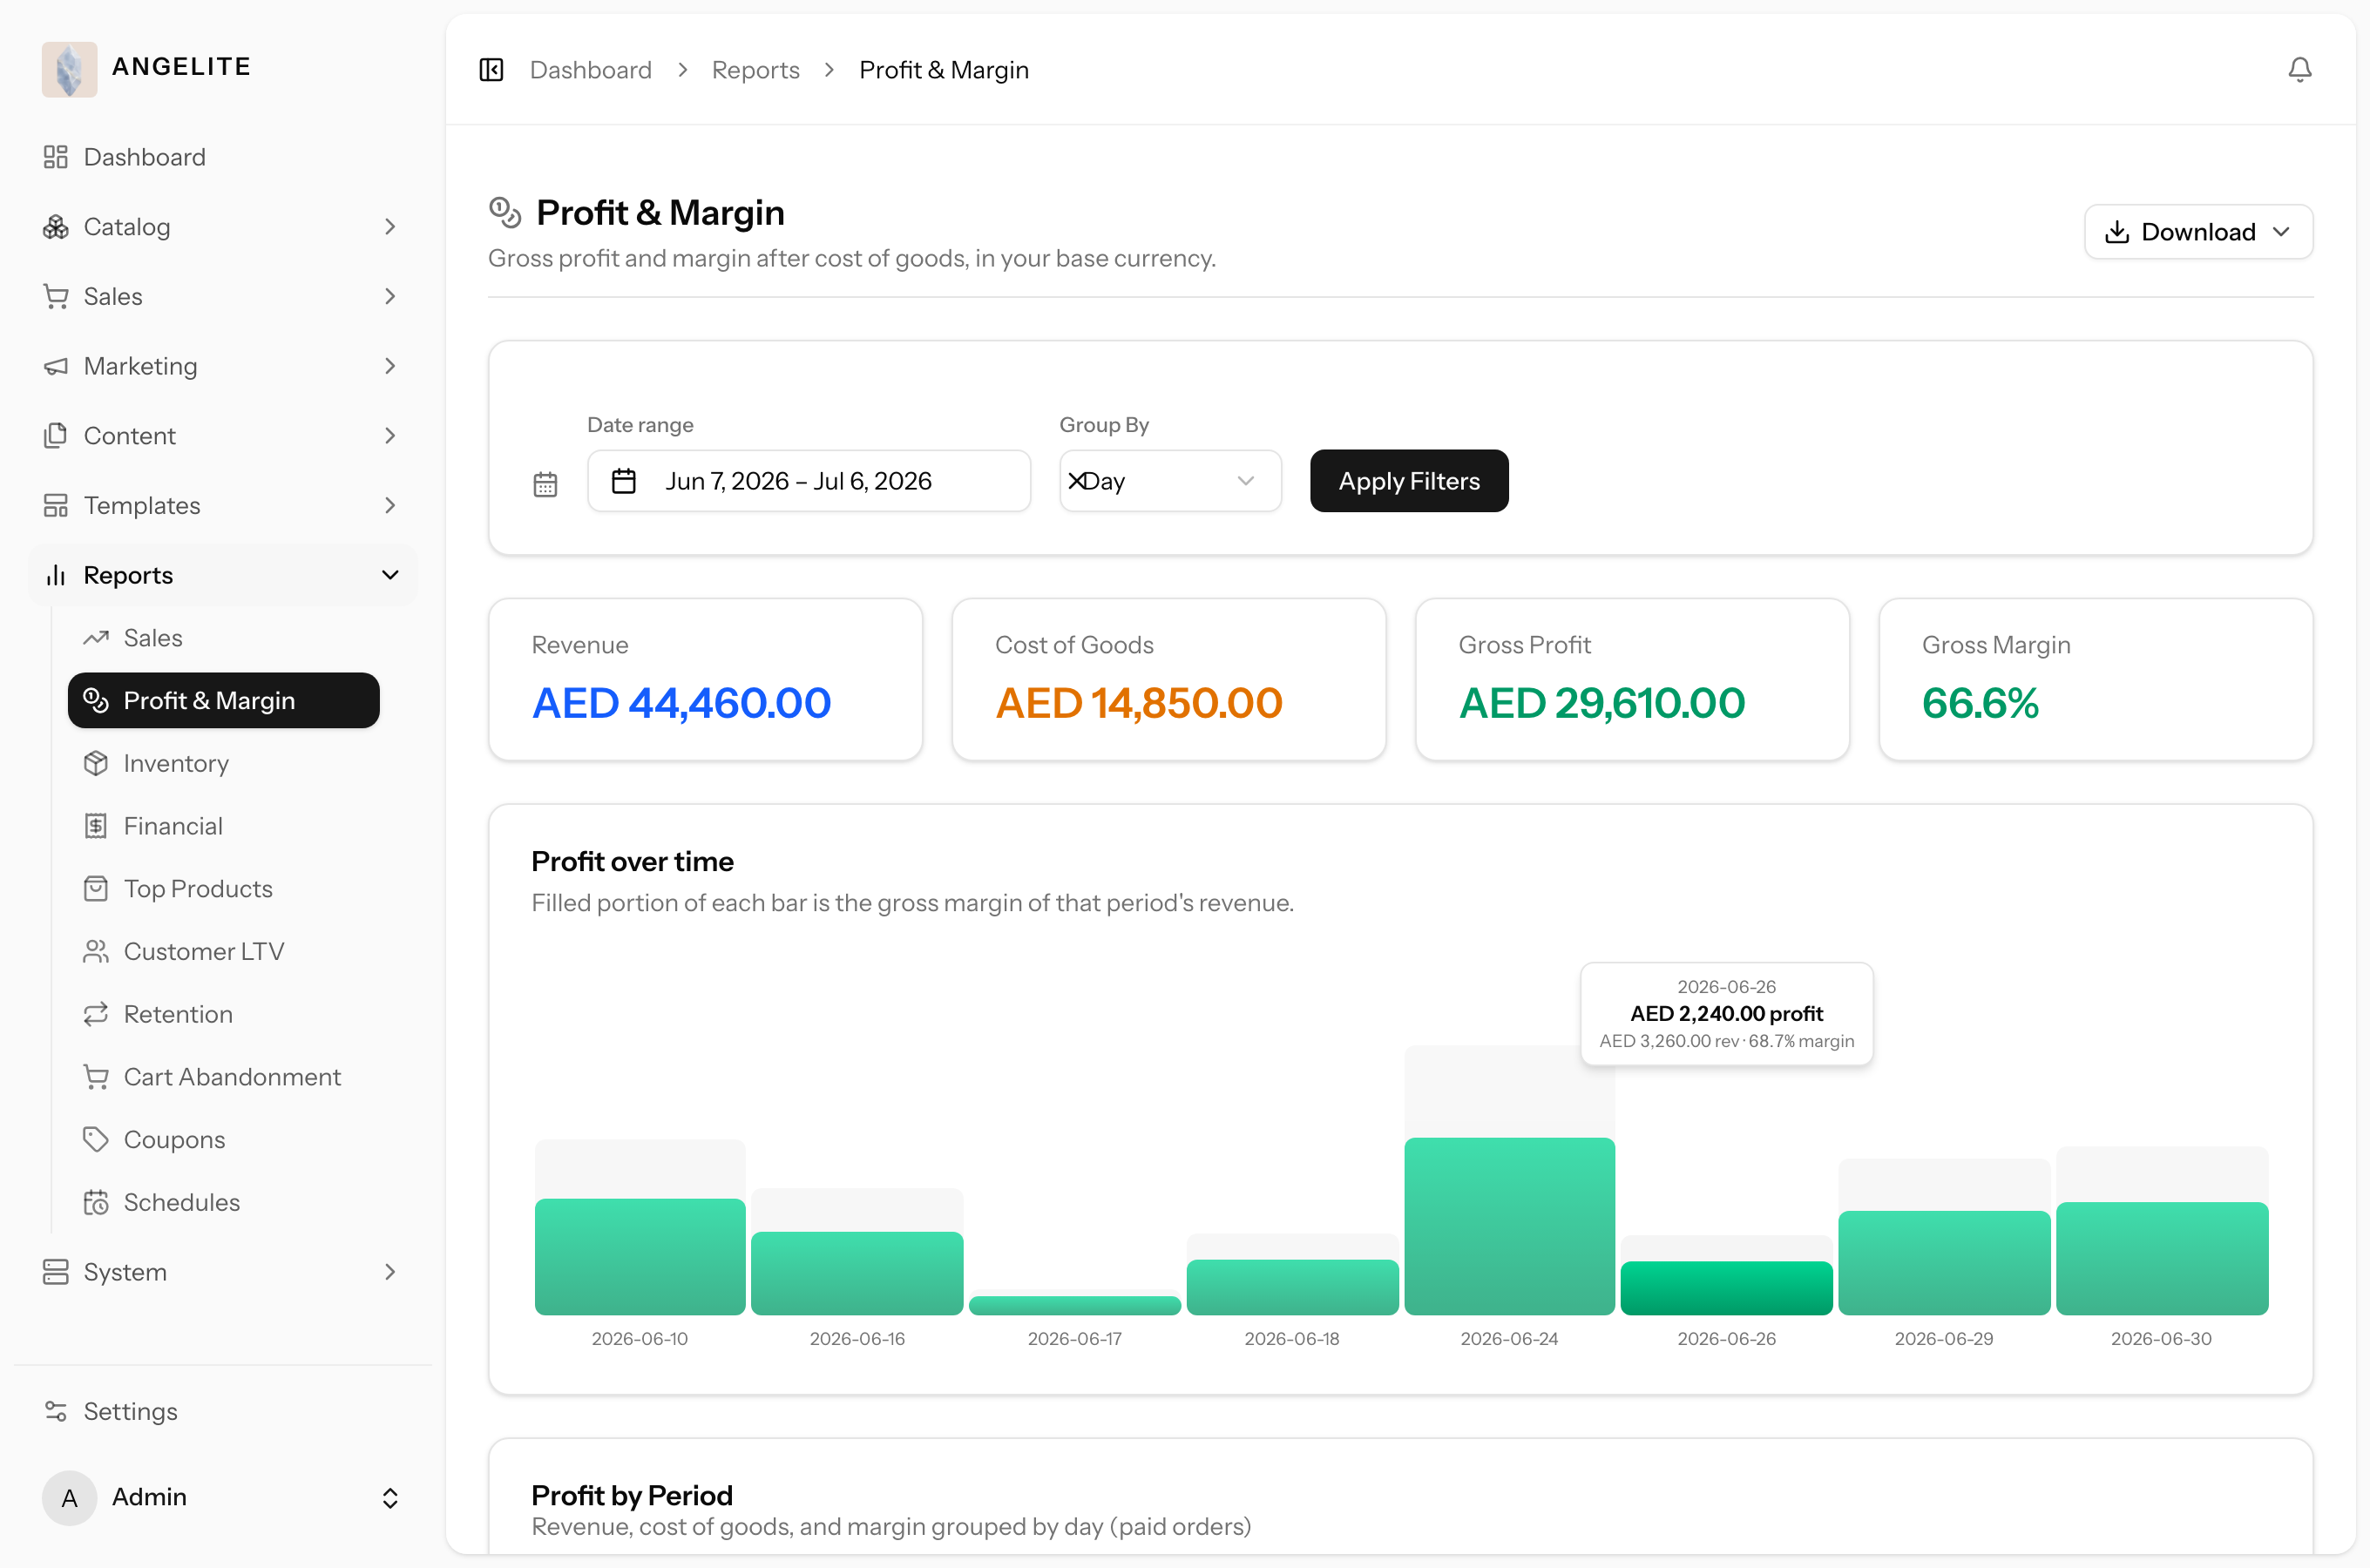
revenue and order counts over time, grouped by day, week or month. Profit & Margin
shows what you actually made after cost, so a discount that eats the margin is caught before it
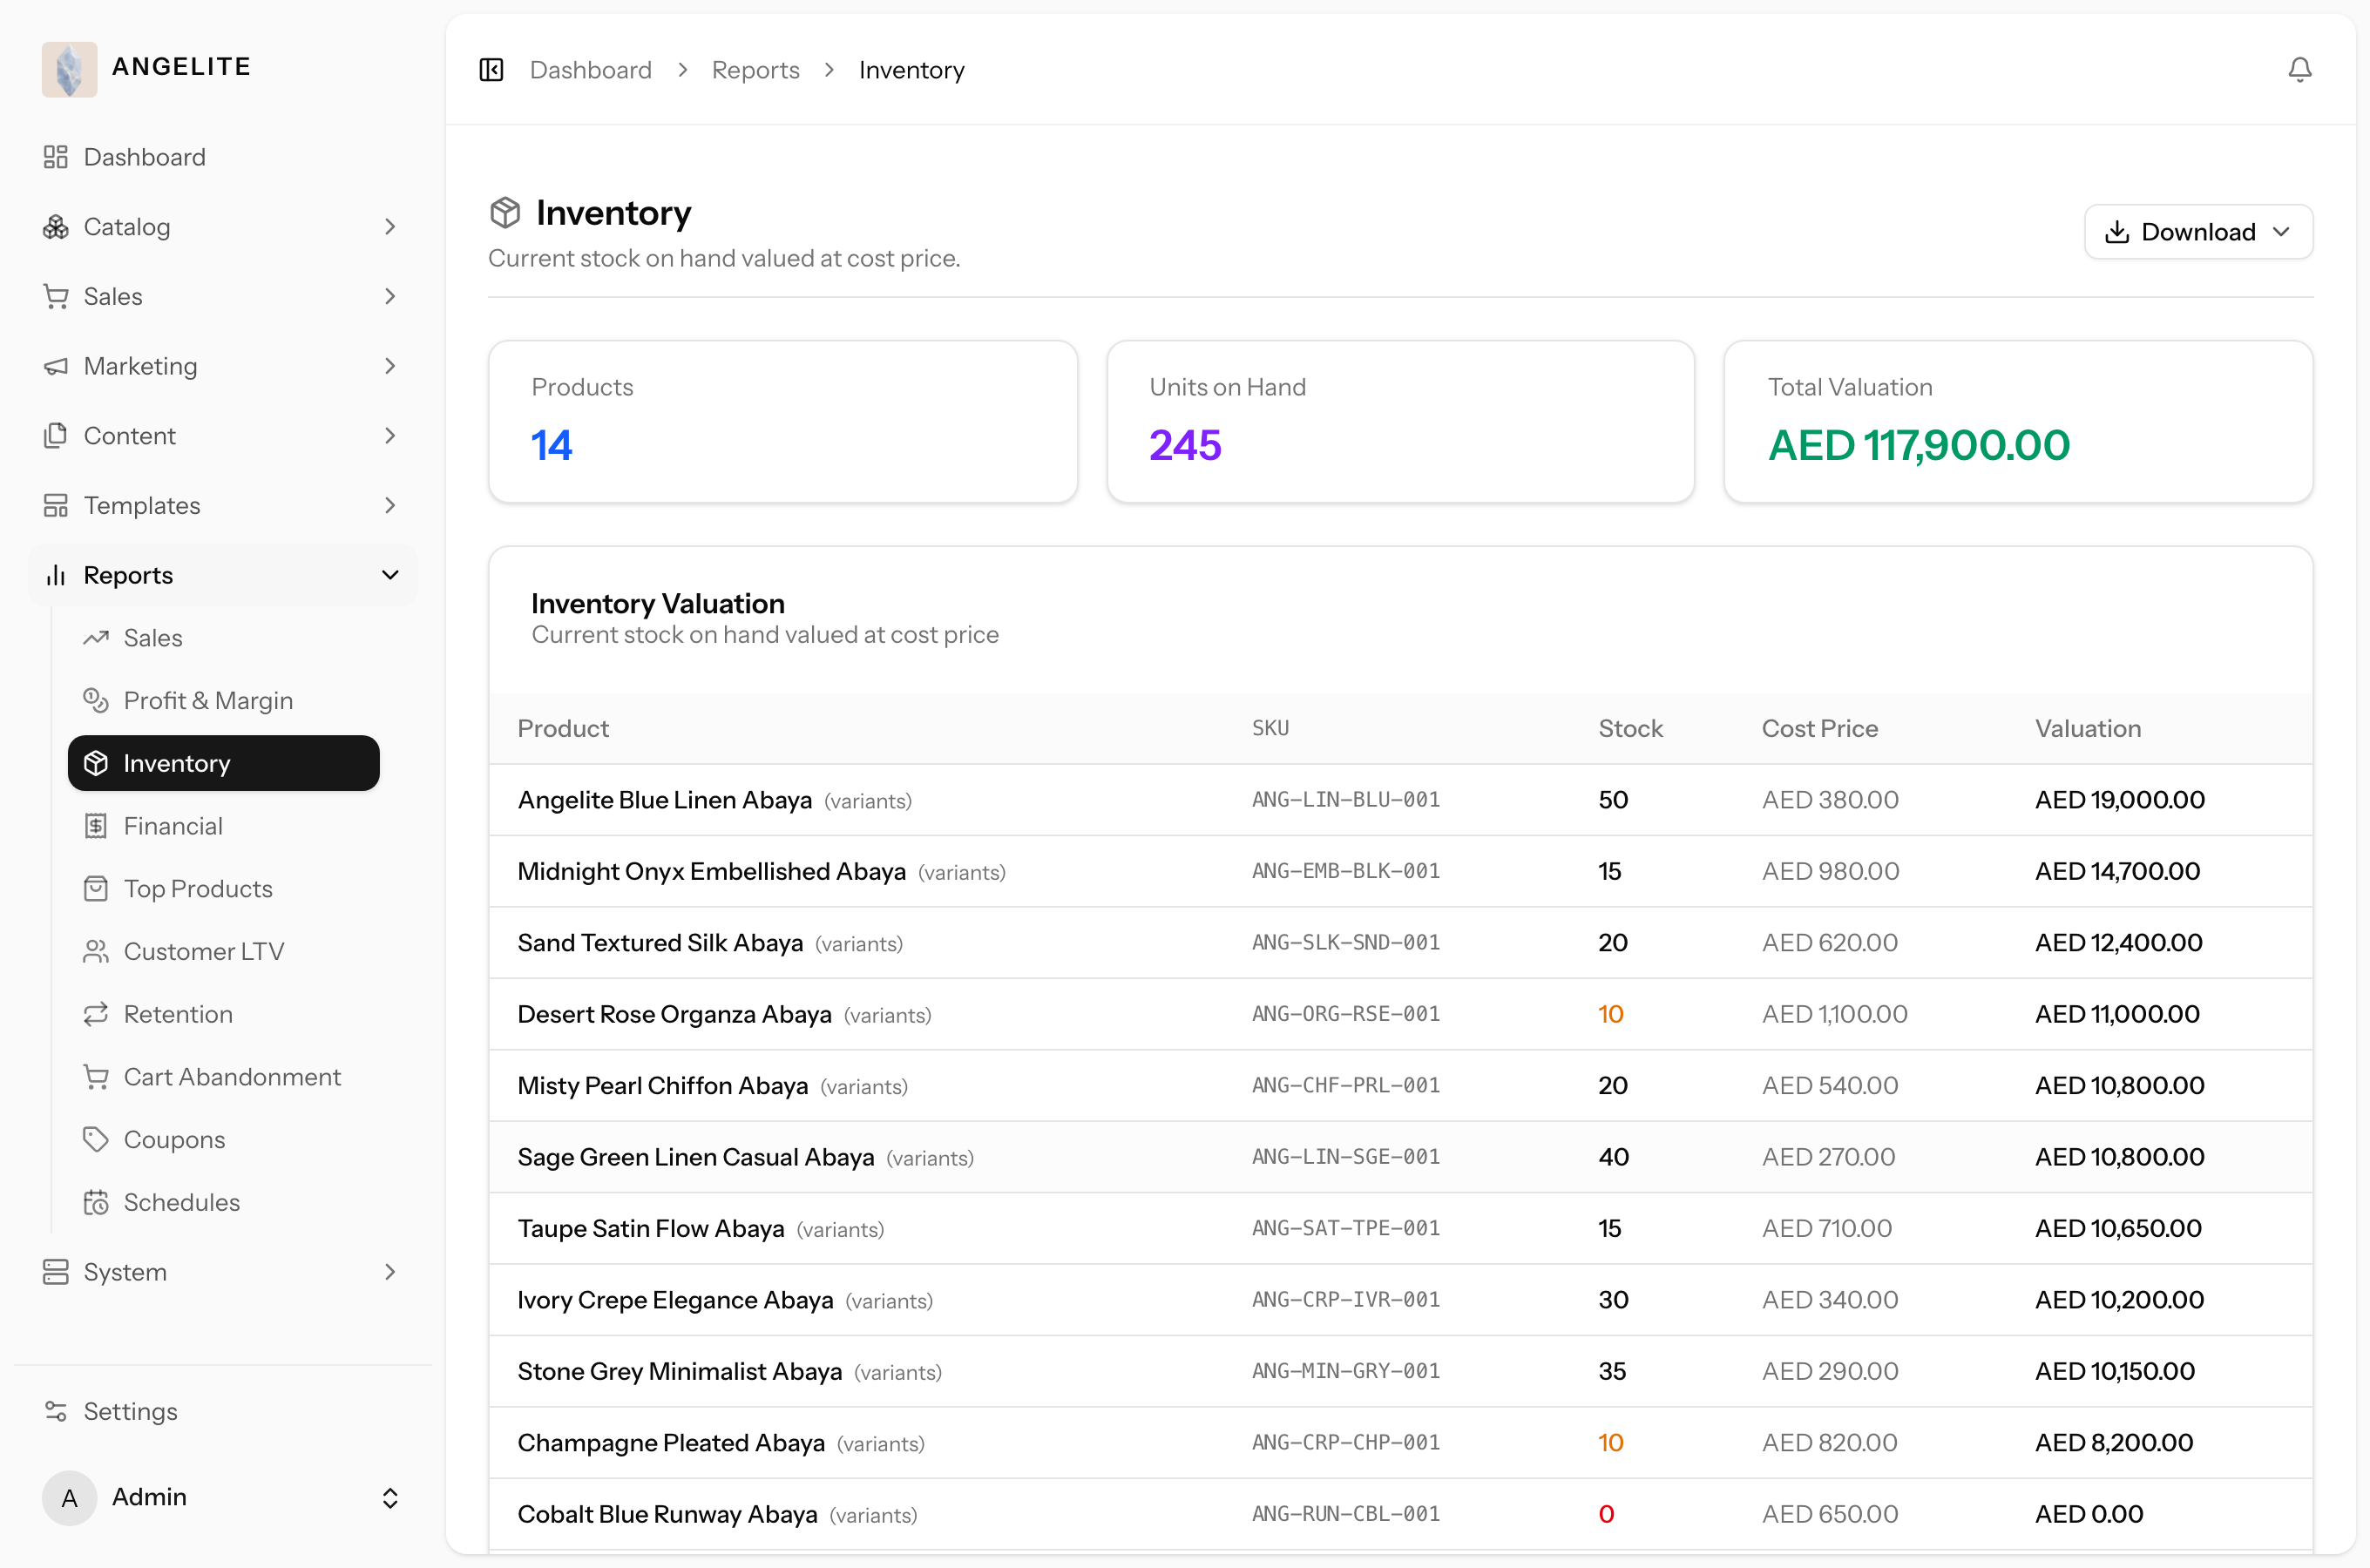
becomes a habit. Inventory values the stock you hold on hand.
In practice
Imagine a busy Eid season has just passed and you want to know the truth behind the rush: did all those Eid-gifting orders actually leave you with profit, or did the discounts eat it up, and how much embroidered-abaya stock is still tied up on the shelves.
How Angelite handles it: you open Reports → Sales grouped by week to see the spike in paid orders, then switch to Profit & Margin to see revenue set against your cost so you know what you really earned. Finally Inventory tells you the value of the abayas and fabric you are still holding. These three are always there on every store, no setup needed.
How to use it
Open Reports → Sales and choose your date range and grouping (day, week or month).
Open Reports → Profit & Margin to see revenue against cost for the period.
Open Reports → Inventory to see the value of the stock you currently hold.
Apply a date range where offered, then read or download the table.
Where: Reports → Sales, with summary cards and a table grouped by period.Where: Reports → Profit & Margin.Where: Reports → Inventory.
Good to know: revenue here means paid revenue. Orders that were never
paid, or that were later refunded, are not counted as income.
Pro reports
AdminOptional · Pro Reports
The problem: you can see what sold yesterday, but not which
customers quietly carry the business, which styles genuinely pull their weight, or how many shoppers
fill a bag and walk away at the till.
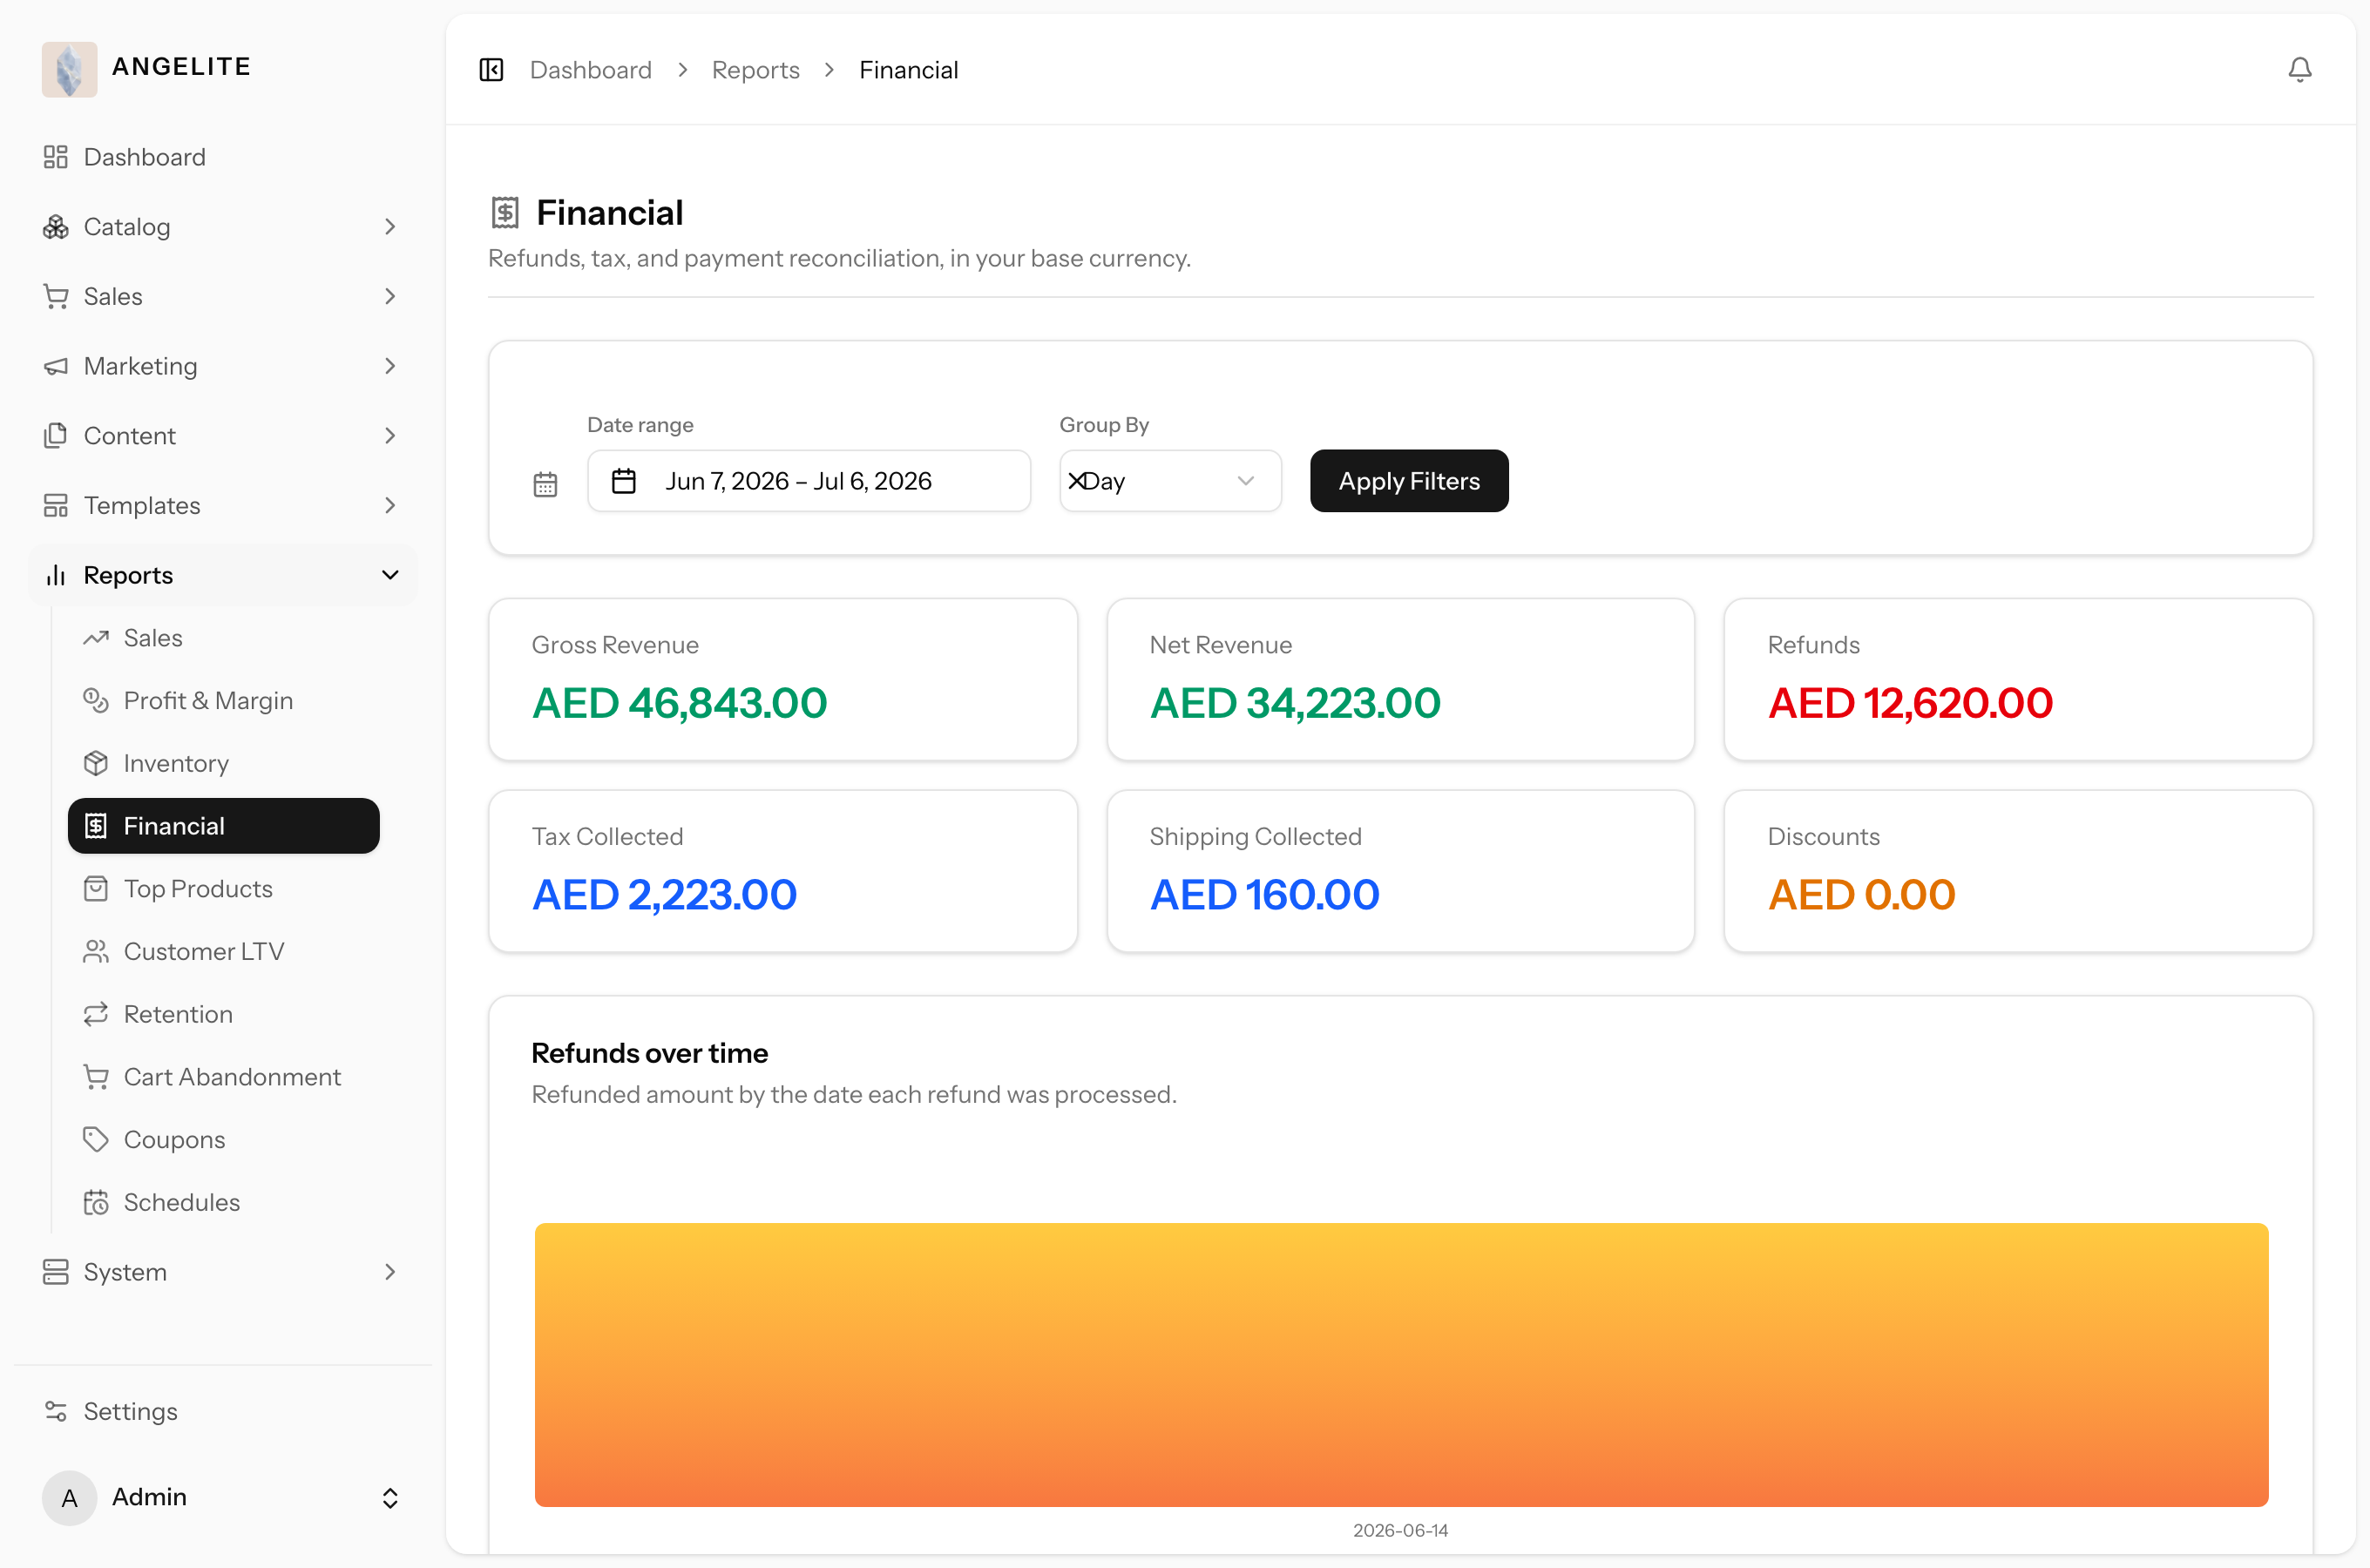
A richer set of reports for deeper insight. Financial matches your
refunds against what the payment provider actually took, so your books and your statement agree.
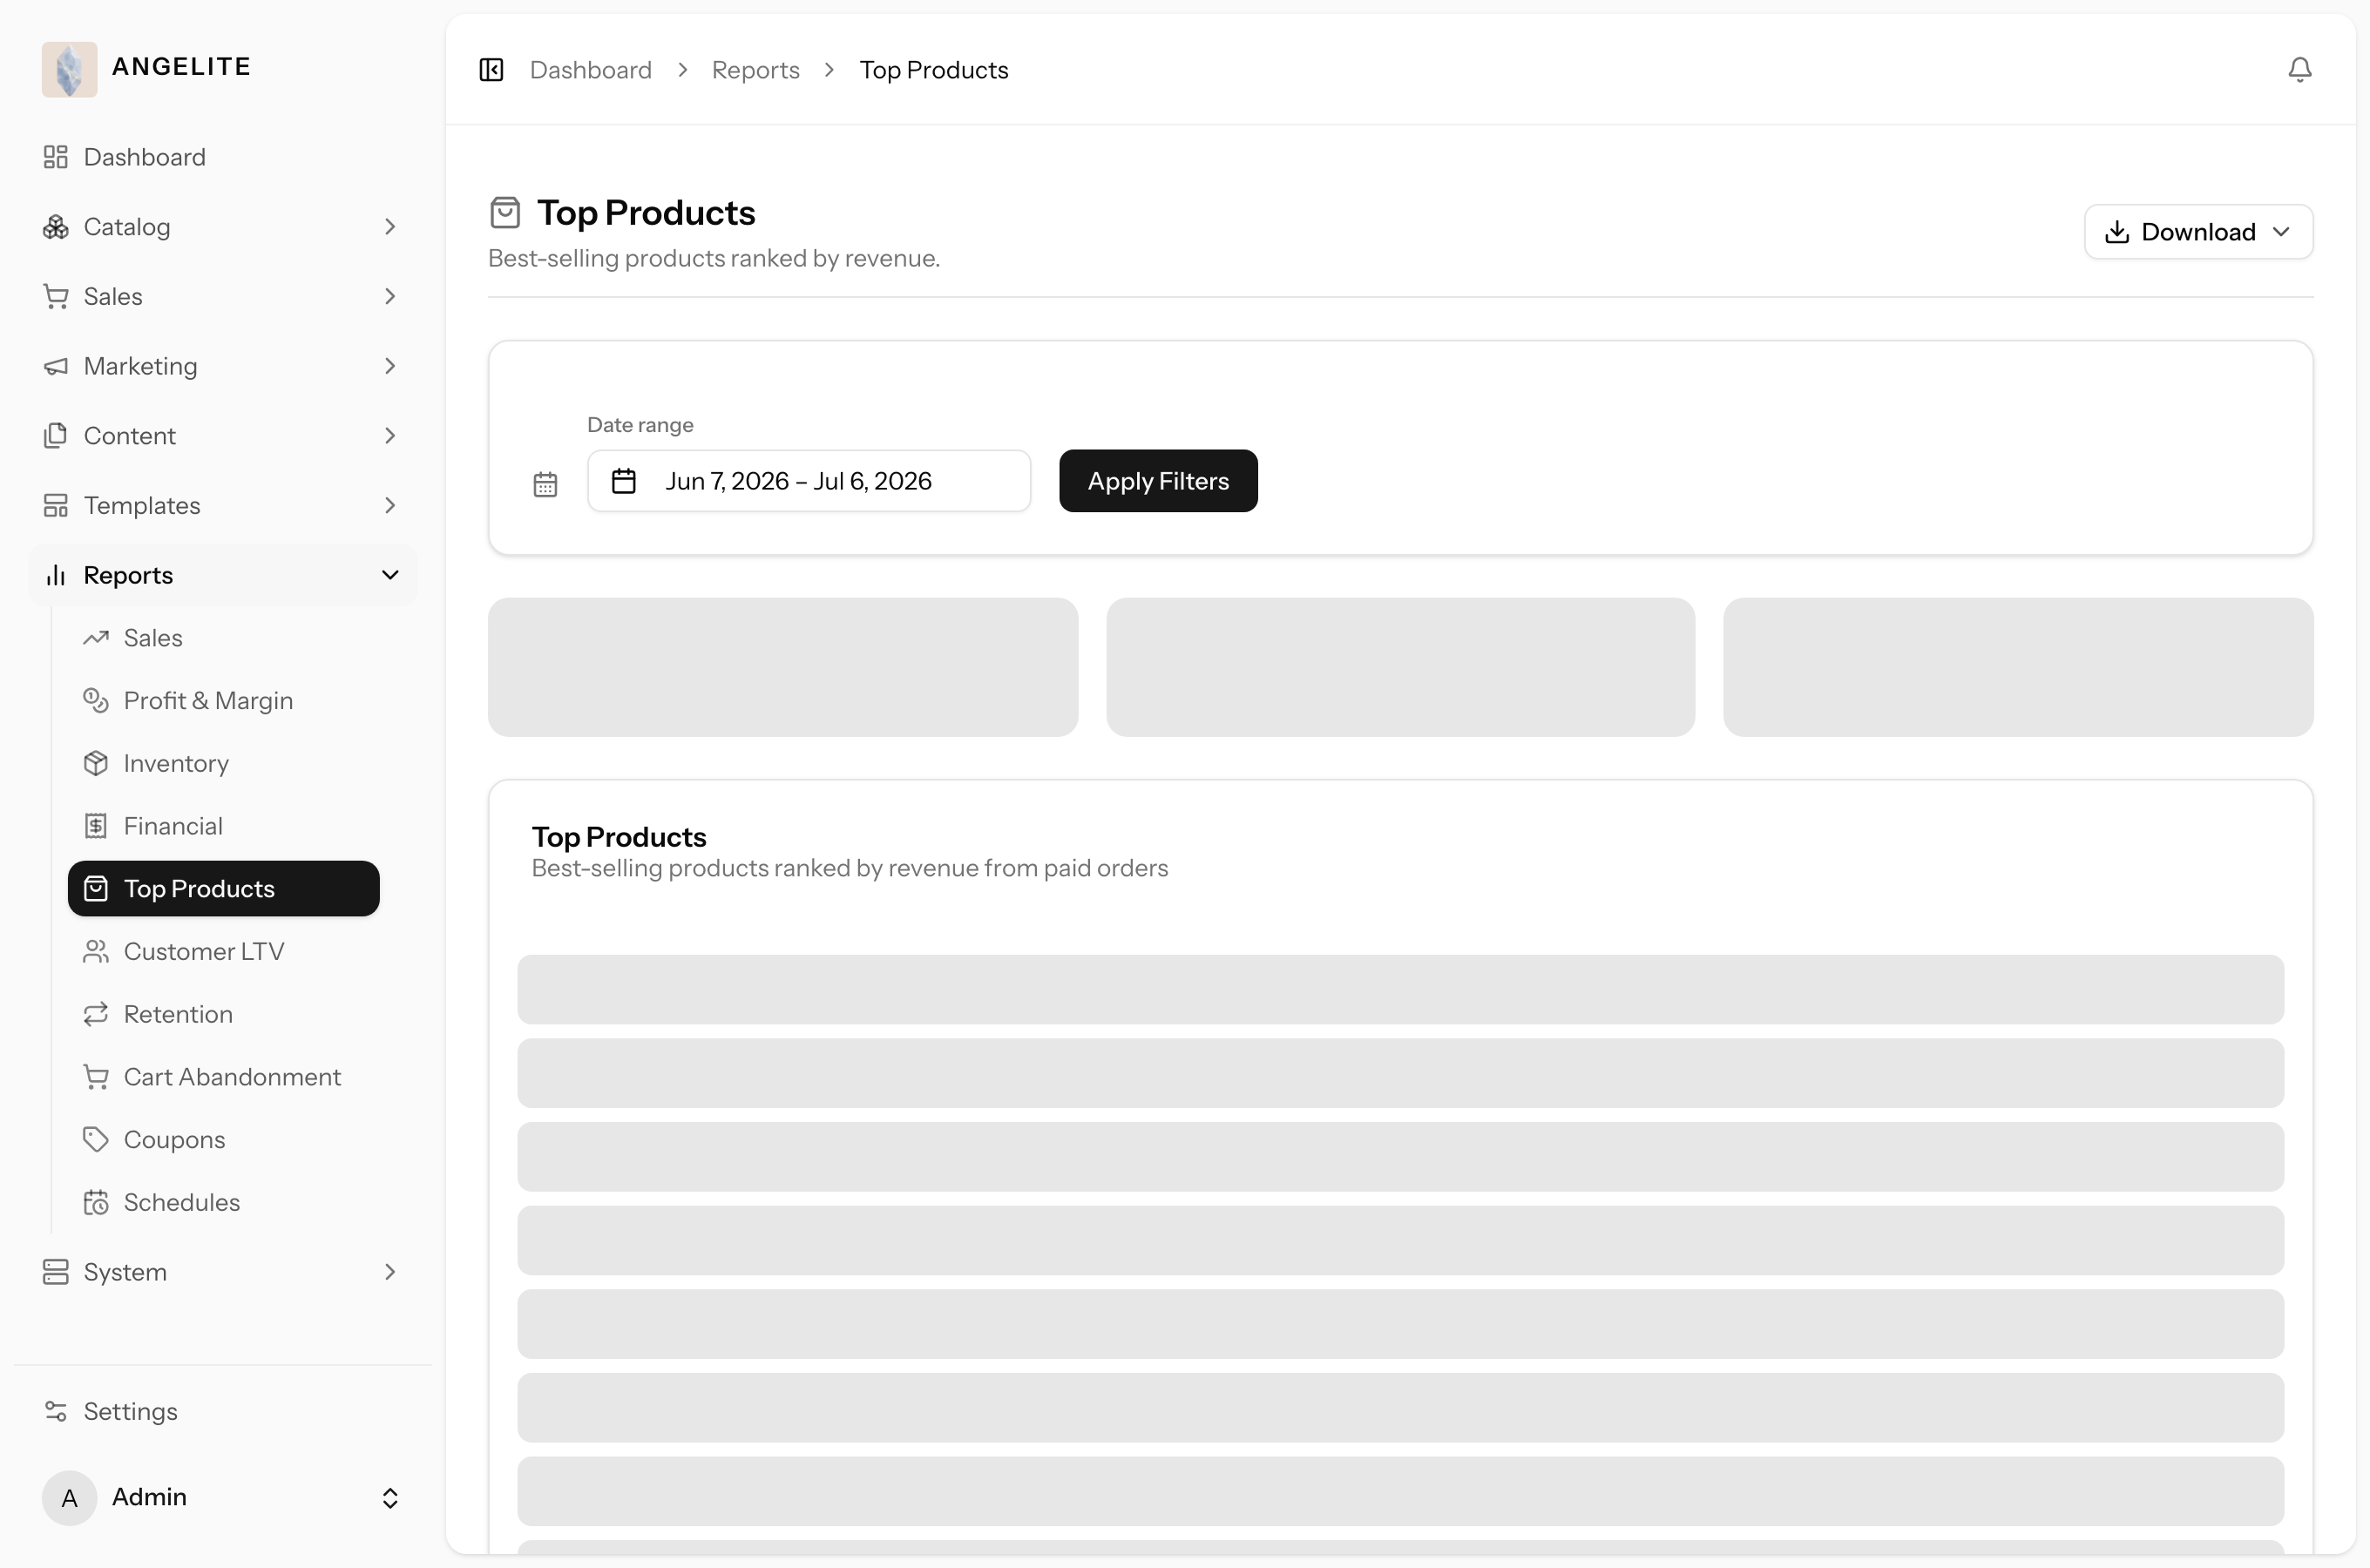
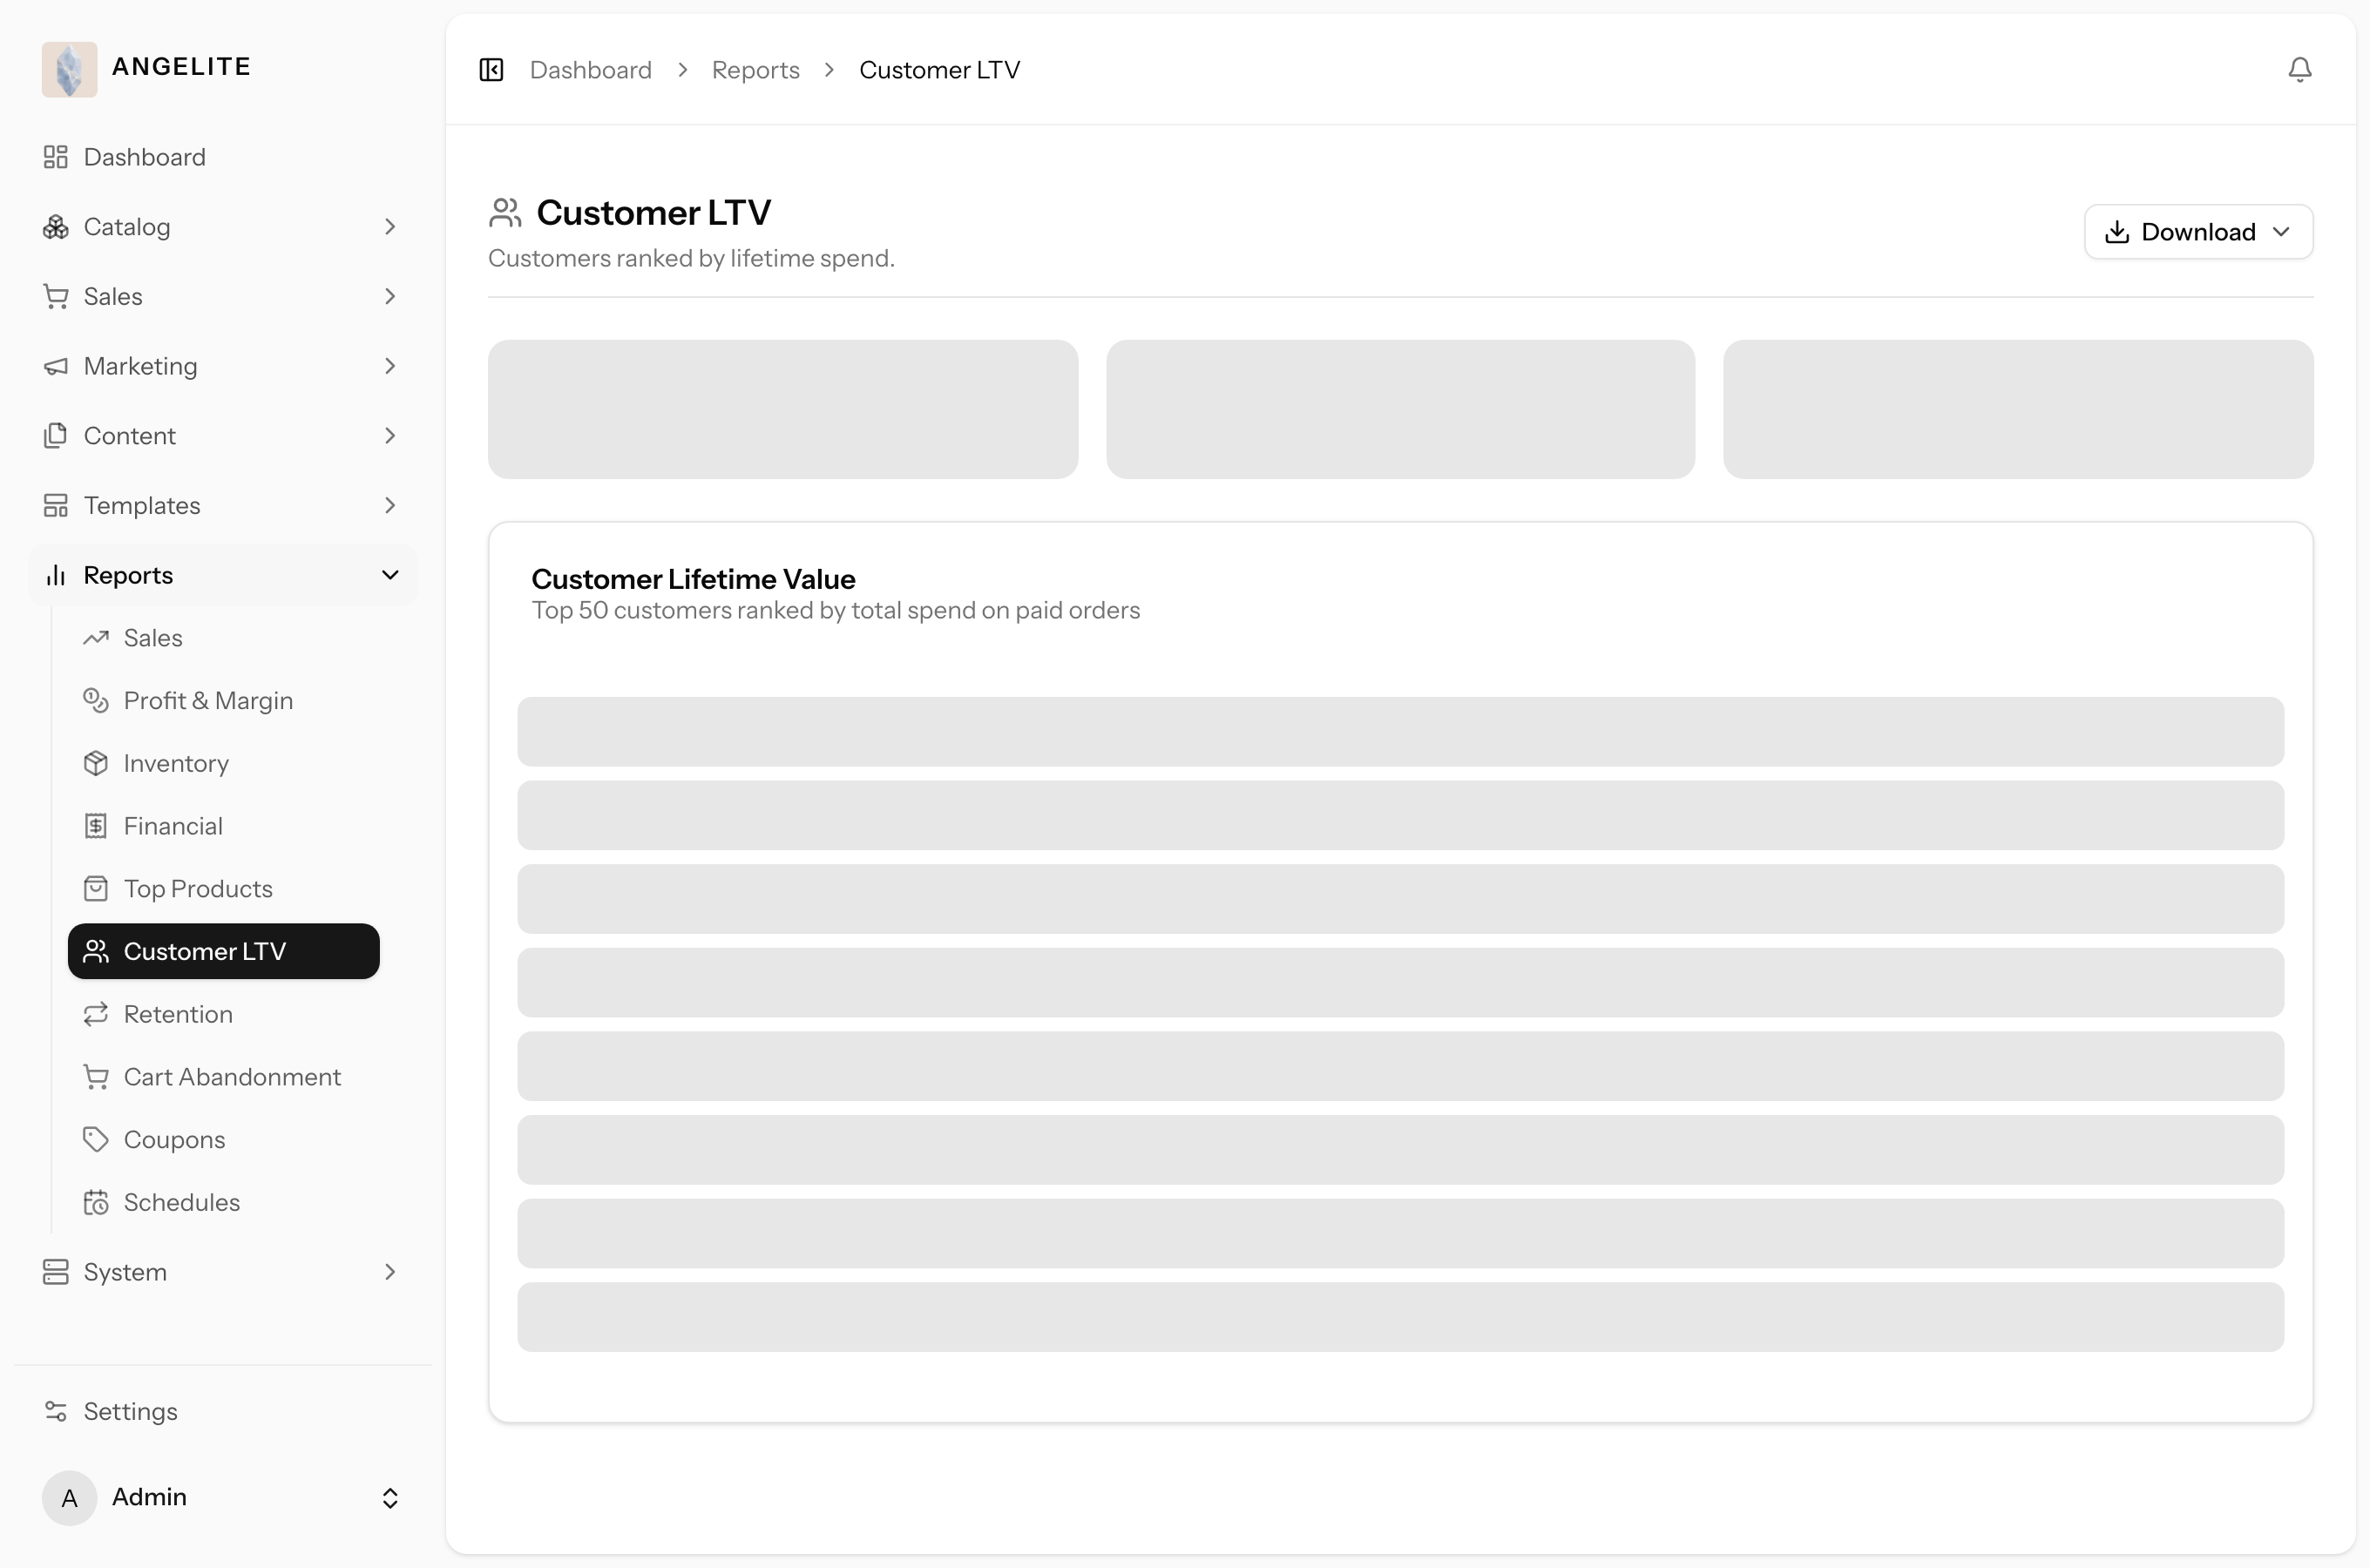
Top Products ranks your best sellers, Customer Lifetime Value shows
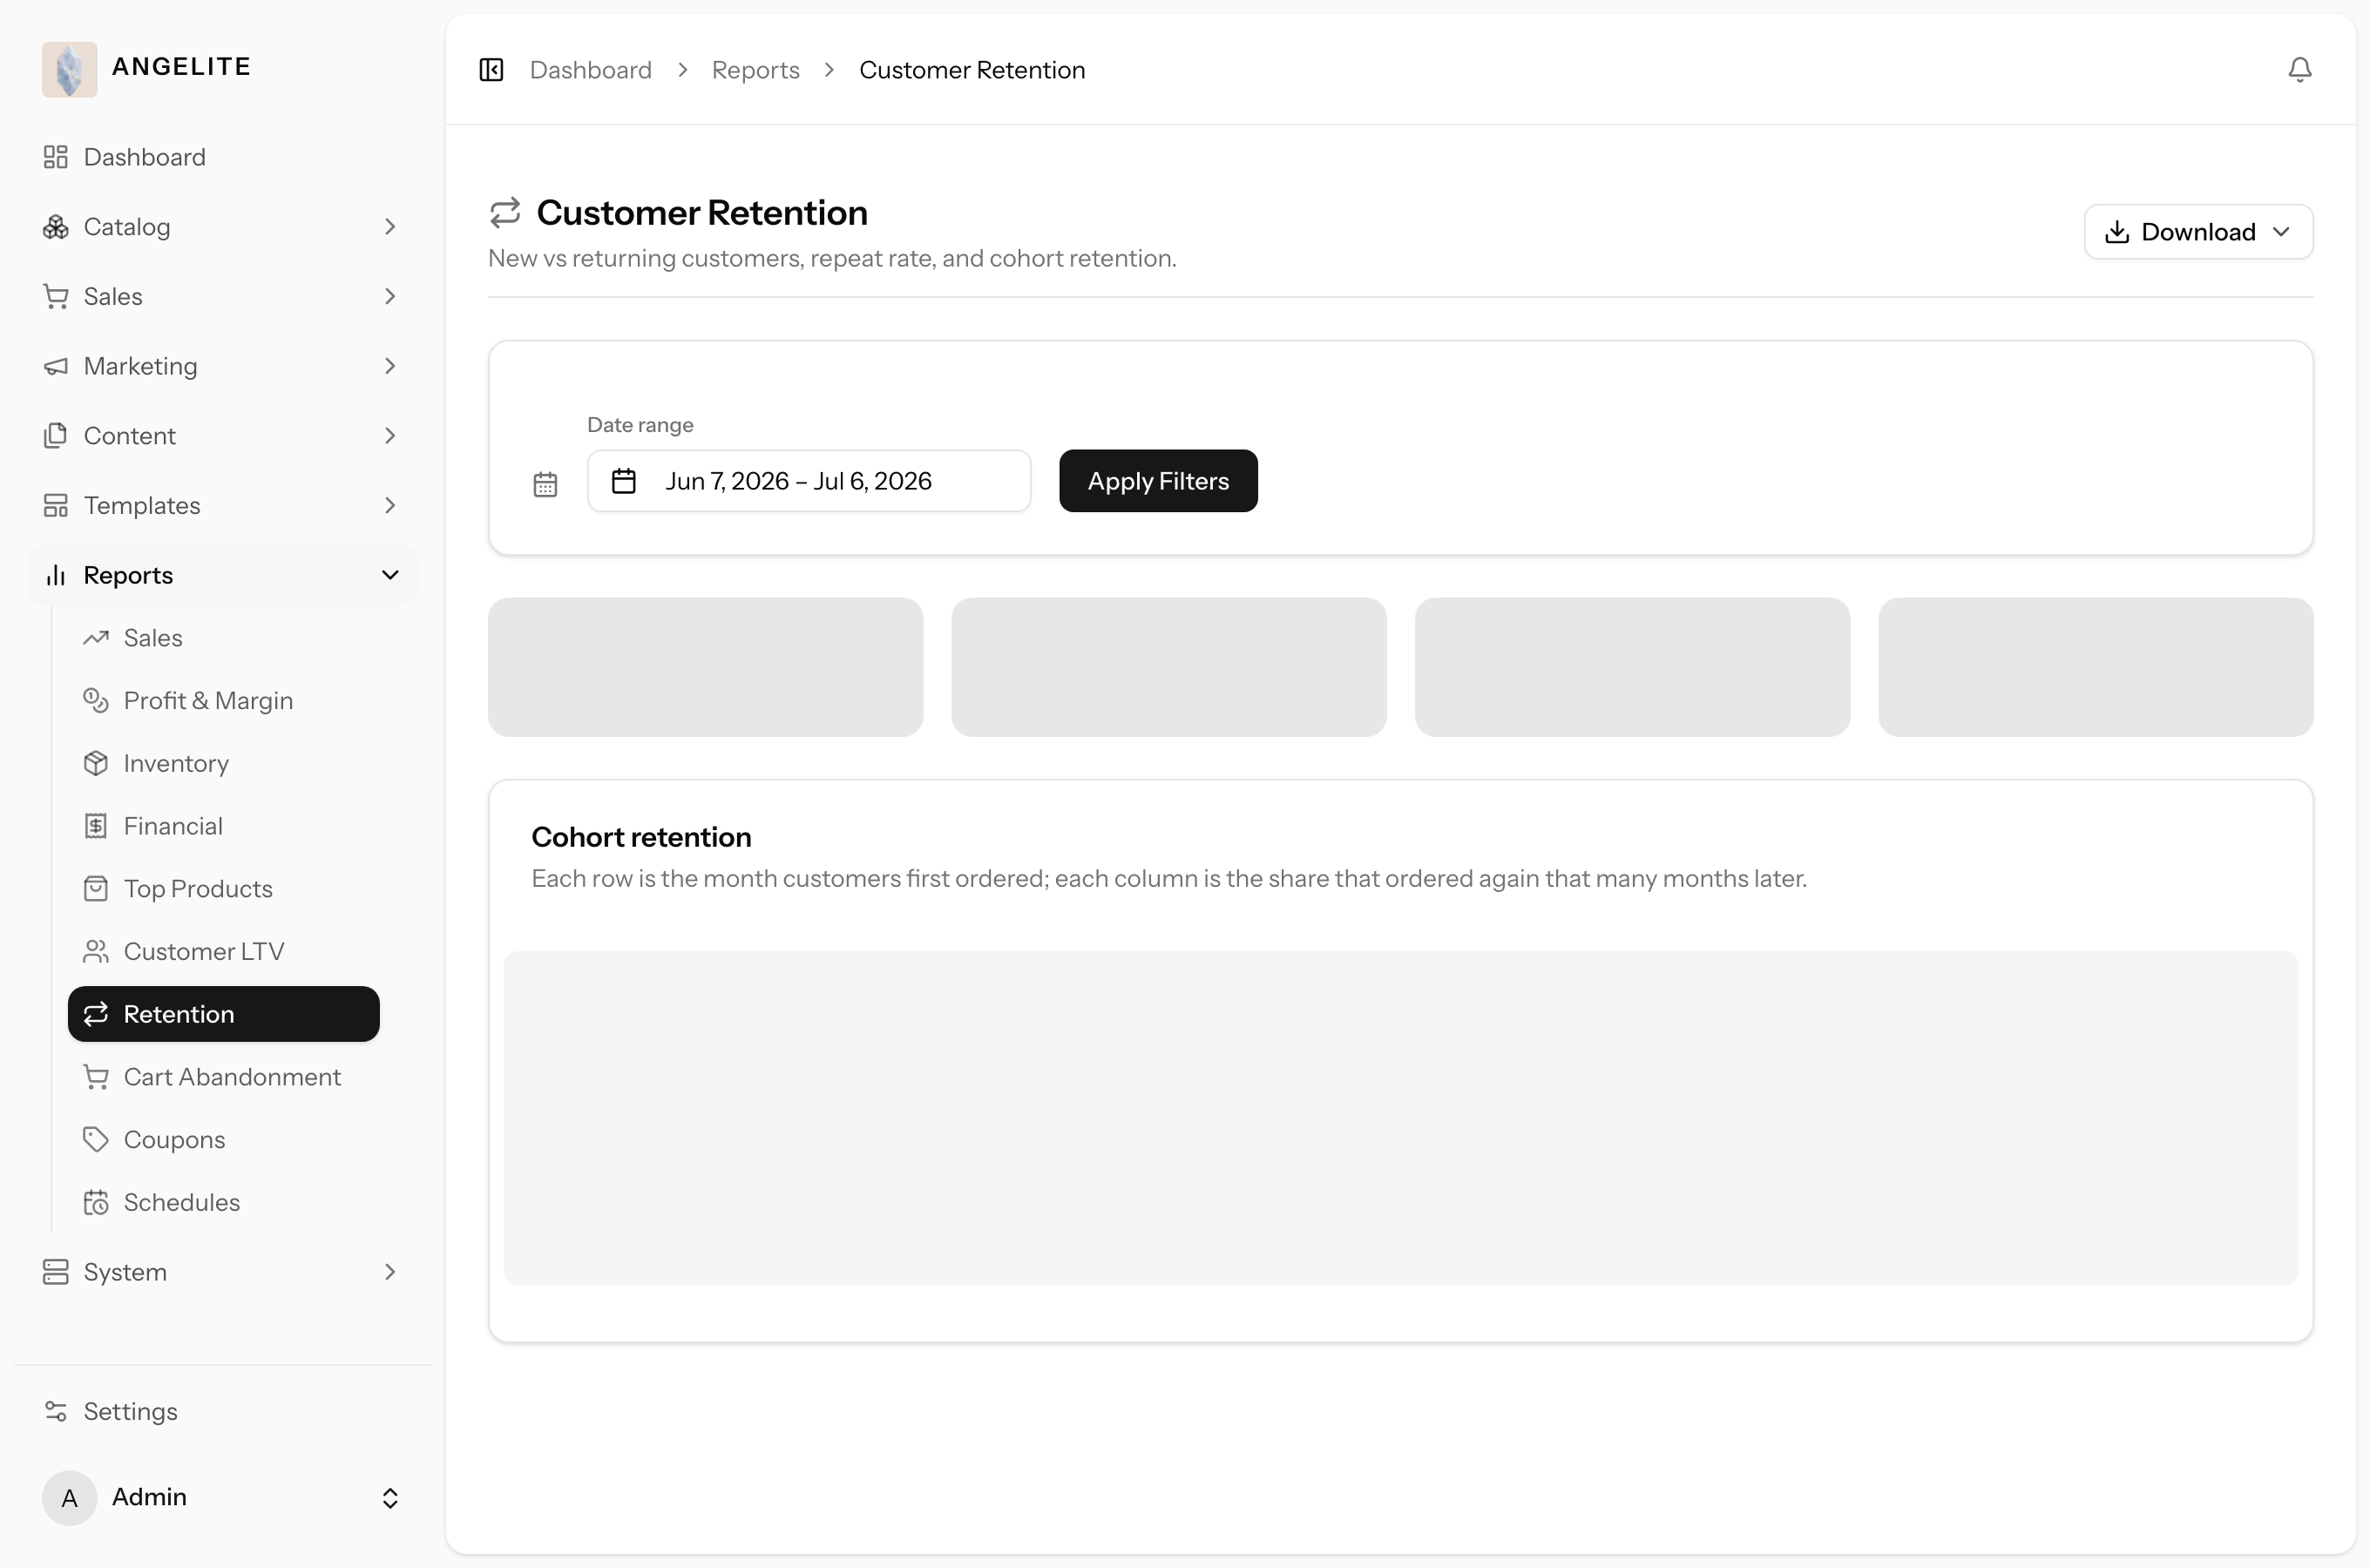
who has spent the most with you over everything they have ever bought, Retention
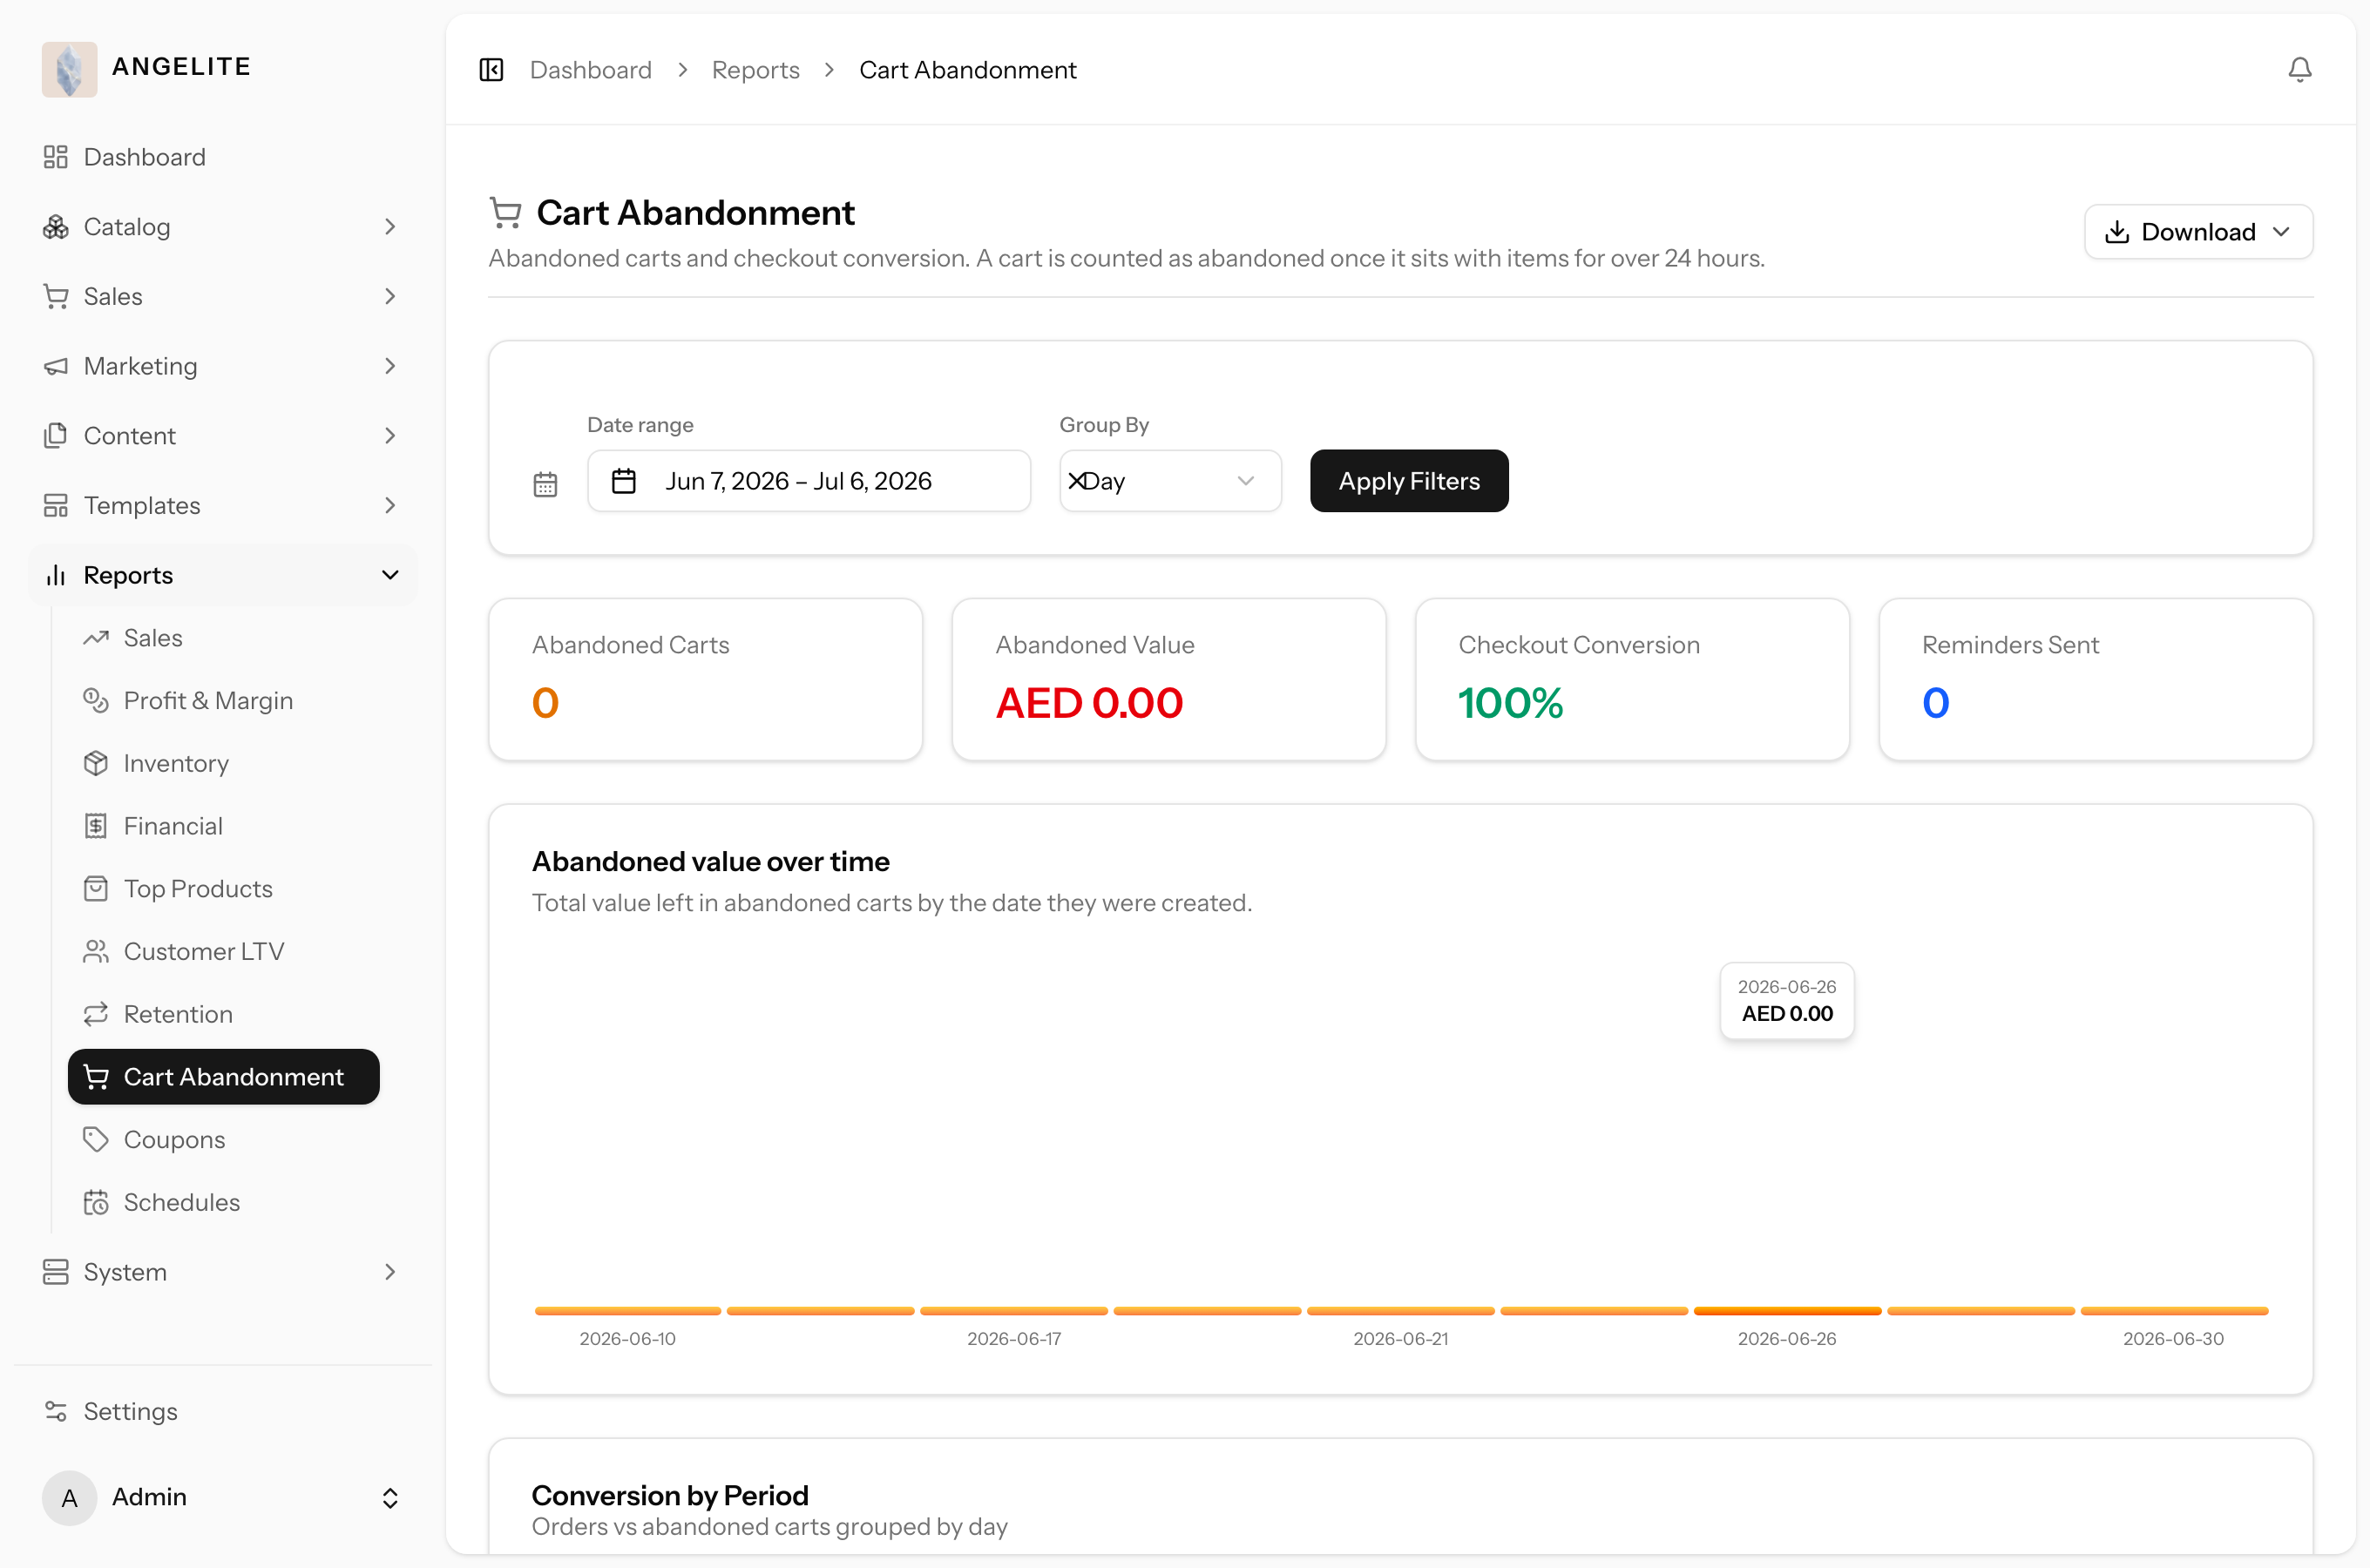
shows how many customers come back to buy again, Cart Abandonment counts the
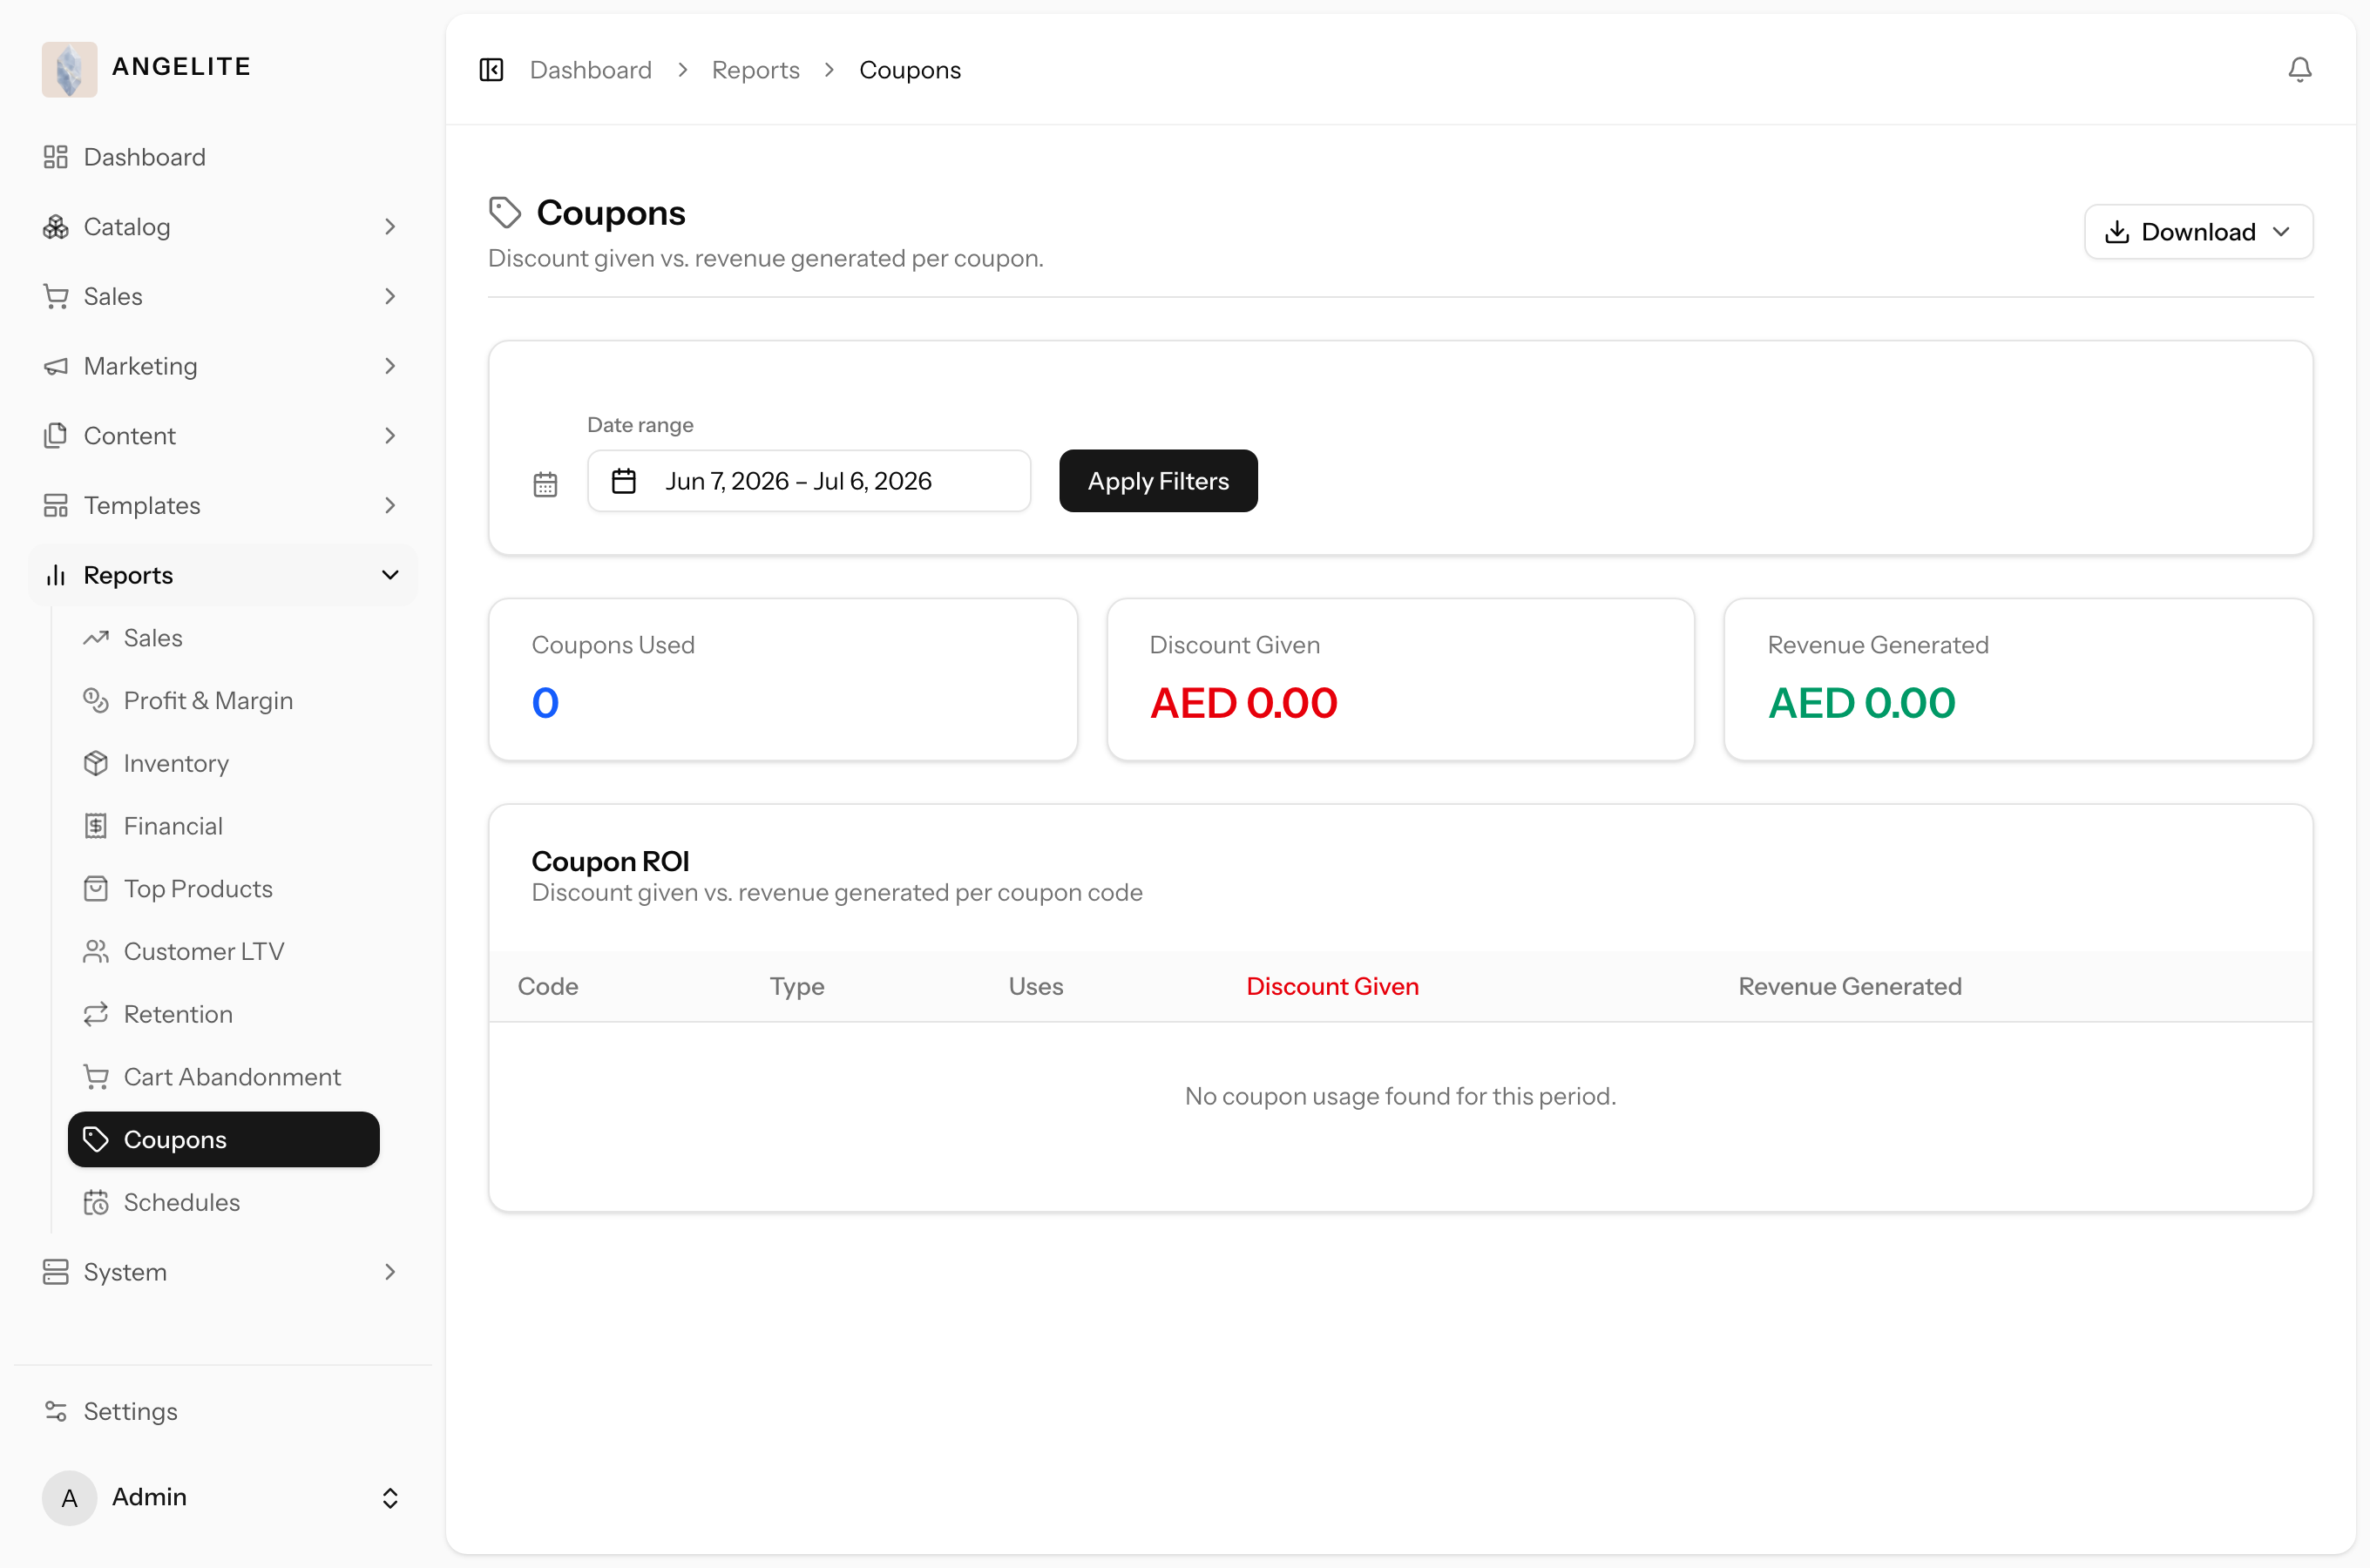
shoppers who left without buying, and Coupons measures how your discounts
performed.
In practice
Say you want to grow the shop in a smarter way: you would like to thank your top spenders with a private preview, find out which abaya styles truly drive sales, and understand how many shoppers fill a bag but leave before paying.
How Angelite handles it: with the Pro reports module switched on under Settings → Features, the Reports sidebar gains the richer set. You open Customer Lifetime Value to see who has spent the most with you, Top Products to rank your best-selling styles, and Cart Abandonment to see the shoppers who left without buying. Retention (who comes back), Financial and Coupons round out the picture, each with a date range you can apply and download.
How to use it
Make sure the Pro reports module is on under Settings → Features.
Open any of the Pro reports from the Reports sidebar group.
Apply a date range where the report offers one, then read the ranked or grouped figures.
Download the report when you want to share or keep the numbers.
Where: Reports → Financial, matching refunds against what the payment provider took.Where: Reports → Top Products.Where: Reports → Customer Lifetime Value.Where: Reports → Retention.Where: Reports → Cart Abandonment.Where: Reports → Coupons.
Optional module: the Pro reports (and scheduled delivery) are switched
on or off under Settings → Features. With it on, your store keeps the full set.
Sharing the numbers
Report export
Admin
The problem: your accountant asks for last quarter's figures, and
the choice is a screenshot or an evening spent retyping numbers into a spreadsheet.
Take any report with you as a file. Download it as a CSV (works on every store) or, with
Pro reports on, as an Excel spreadsheet, so you hand over clean, ready-to-use figures instead of
retyping numbers from a screen.
In practice
Say your accountant asks for last quarter's sales figures in a spreadsheet she can drop straight into her own books, not a screenshot.
How Angelite handles it: you open the Sales report, set the date range to last quarter, and use the download control on the page. You pick CSV, which opens anywhere, or Excel when the Pro reports module is on. The file arrives with exactly the rows shown for that period, so you can email it to her without retyping a single figure.
How to use it
Open the report you want and set its date range.
Use the download control on the report page.
Choose CSV for a universal file, or Excel when the Pro reports module is on.
The file downloads with exactly the rows shown for your chosen period.
Where: the export control on any report page (Excel appears when Pro reports are on).
Scheduled report delivery
AdminOptional · Pro Reports
The problem: every Sunday you log in just to check how the week
went; the Sunday you forget is the one where something needed catching.
Have the reports you care about emailed to you automatically on a regular rhythm, so the
numbers land in your inbox without anyone logging in to fetch them, and the weekly check-in happens
even on the week you forget.
In practice
Imagine every Sunday morning you find yourself logging in just to check how the week went, and you would rather the summary simply be waiting for you, and copied to your business partner too.
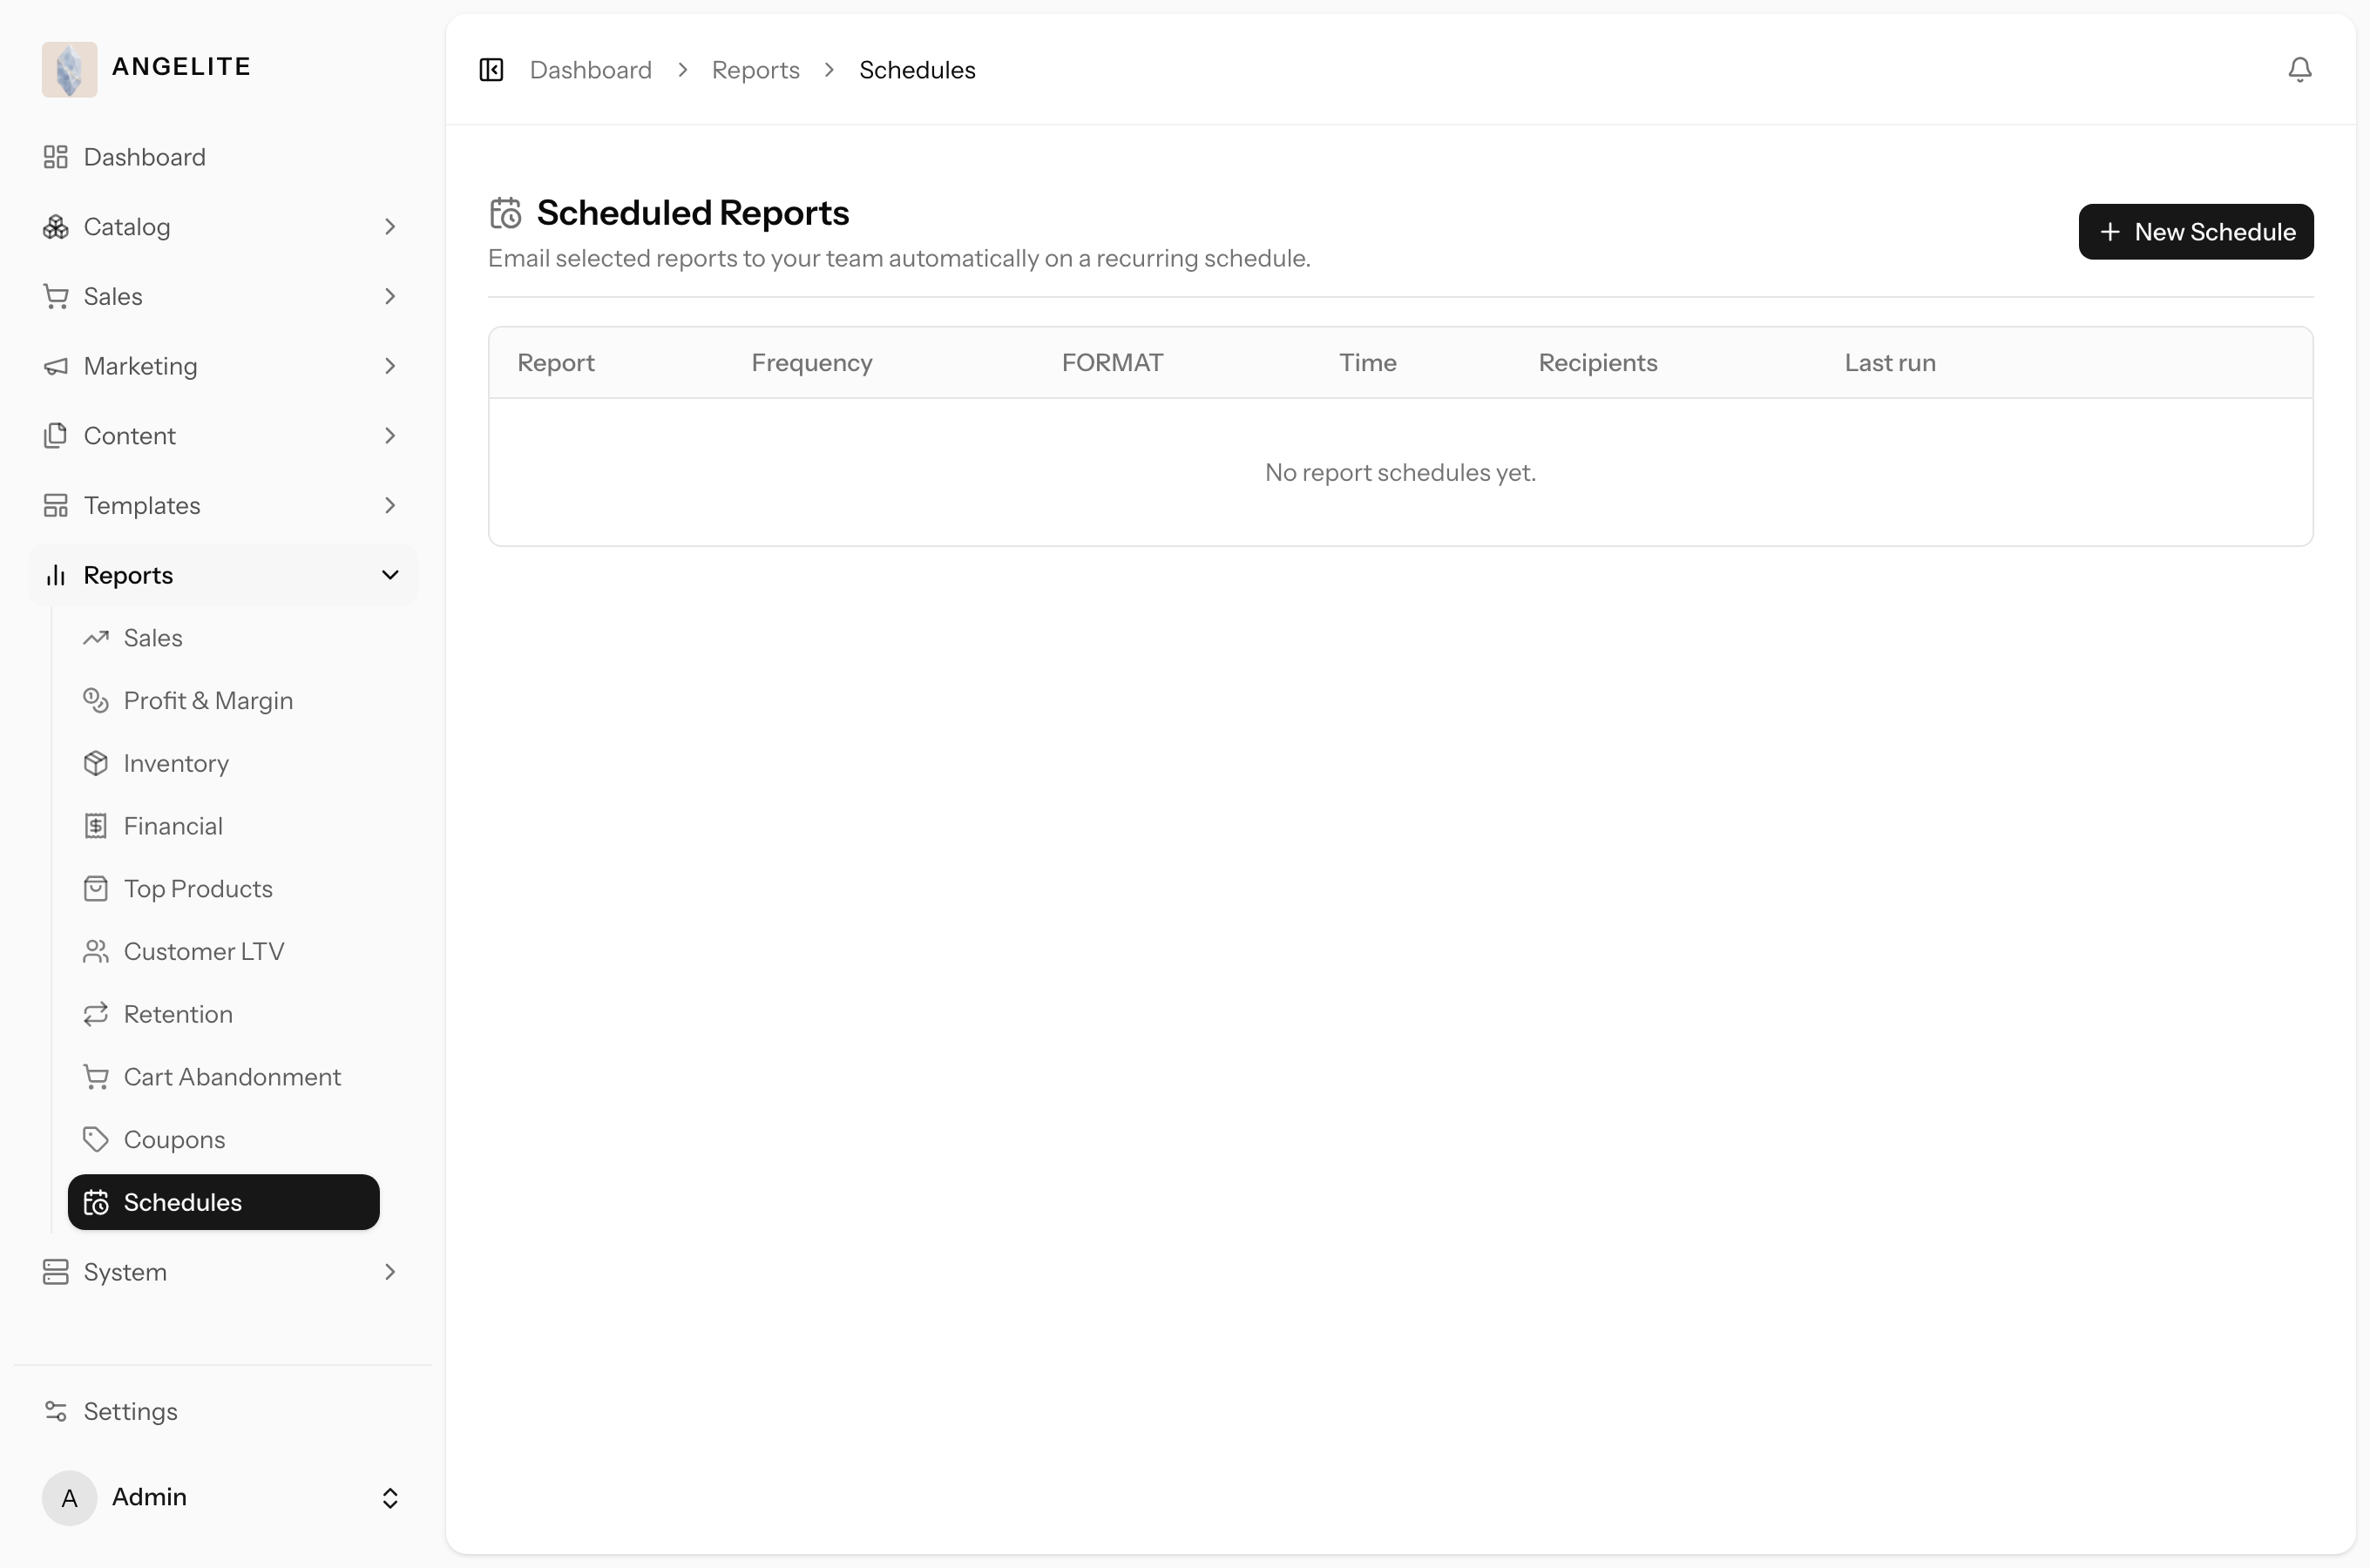
How Angelite handles it: with Pro reports on, you open Reports → Schedules and create a schedule: choose the Sales report, set the cadence to weekly, and add yourself and your partner as recipients. You save, and from then on the report is emailed out on that rhythm with no one logging in to fetch it. You can pause or remove it whenever you like.
How to use it
Make sure the Pro reports module is on under Settings → Features.
Open Reports → Schedules.
Create a schedule: choose the report, the cadence (for example weekly), and who should receive it.
Save. The report is now delivered by email on that schedule until you pause or remove it.
Where: Reports → Schedules.
Good to know: scheduled delivery is part of the Pro reports module; if
that module is turned off, deliveries pause.
Understanding your visitors
Storefront analytics
AdminOptional · Analytics
The problem: you spend money and effort on an Instagram push and
honestly cannot say whether it brought anyone to the shop, let alone whether they bought or just
looked and left.
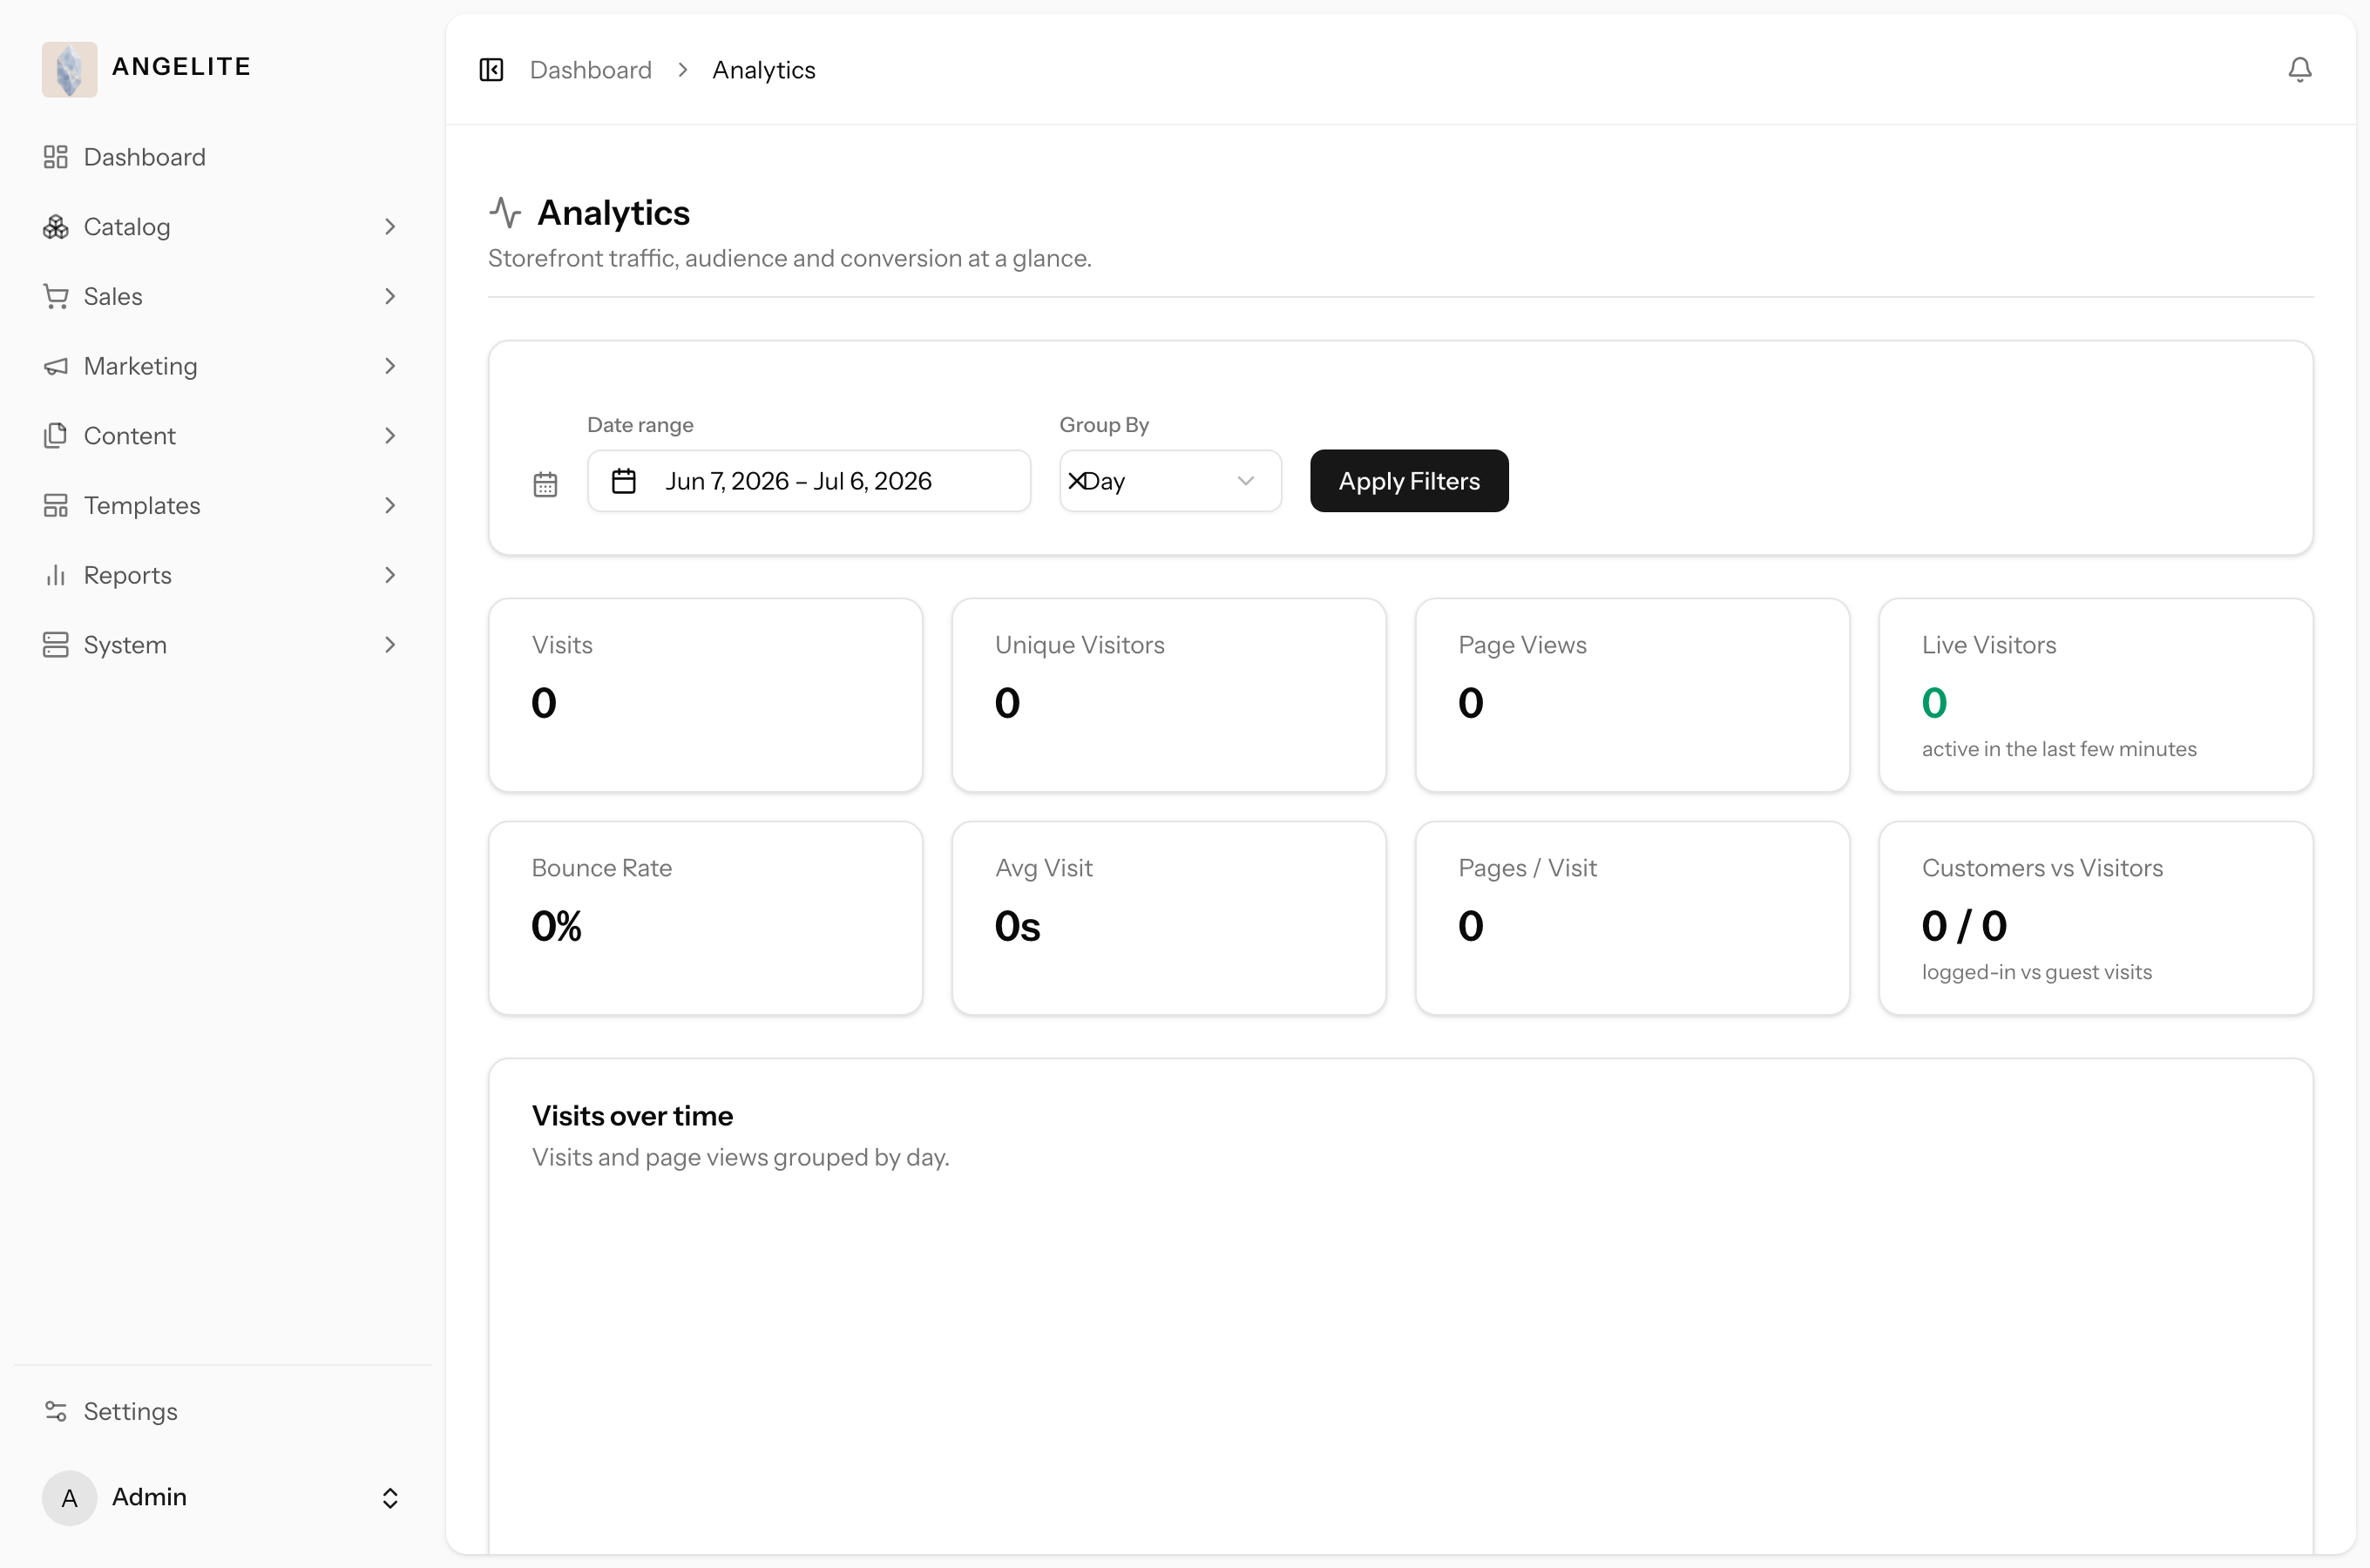
A dashboard of how people actually use your storefront, not just what they bought.
It covers how many visits and unique visitors you get, which pages and products draw the most
attention, what shoppers search for, and how many of those visits turn into a sale, all filterable
by date. And there is no personal tracking of any kind: visits are counted anonymously, with nothing
that could identify an individual shopper.
In practice
Say you have just run an Instagram push for a new collection and want to know whether it actually brought people to the site, and whether they went on to buy anything or just looked and left.
How Angelite handles it: with Analytics switched on, you open the Analytics section
and set the date range to the days around your push. You see a jump in visits and unique visitors,
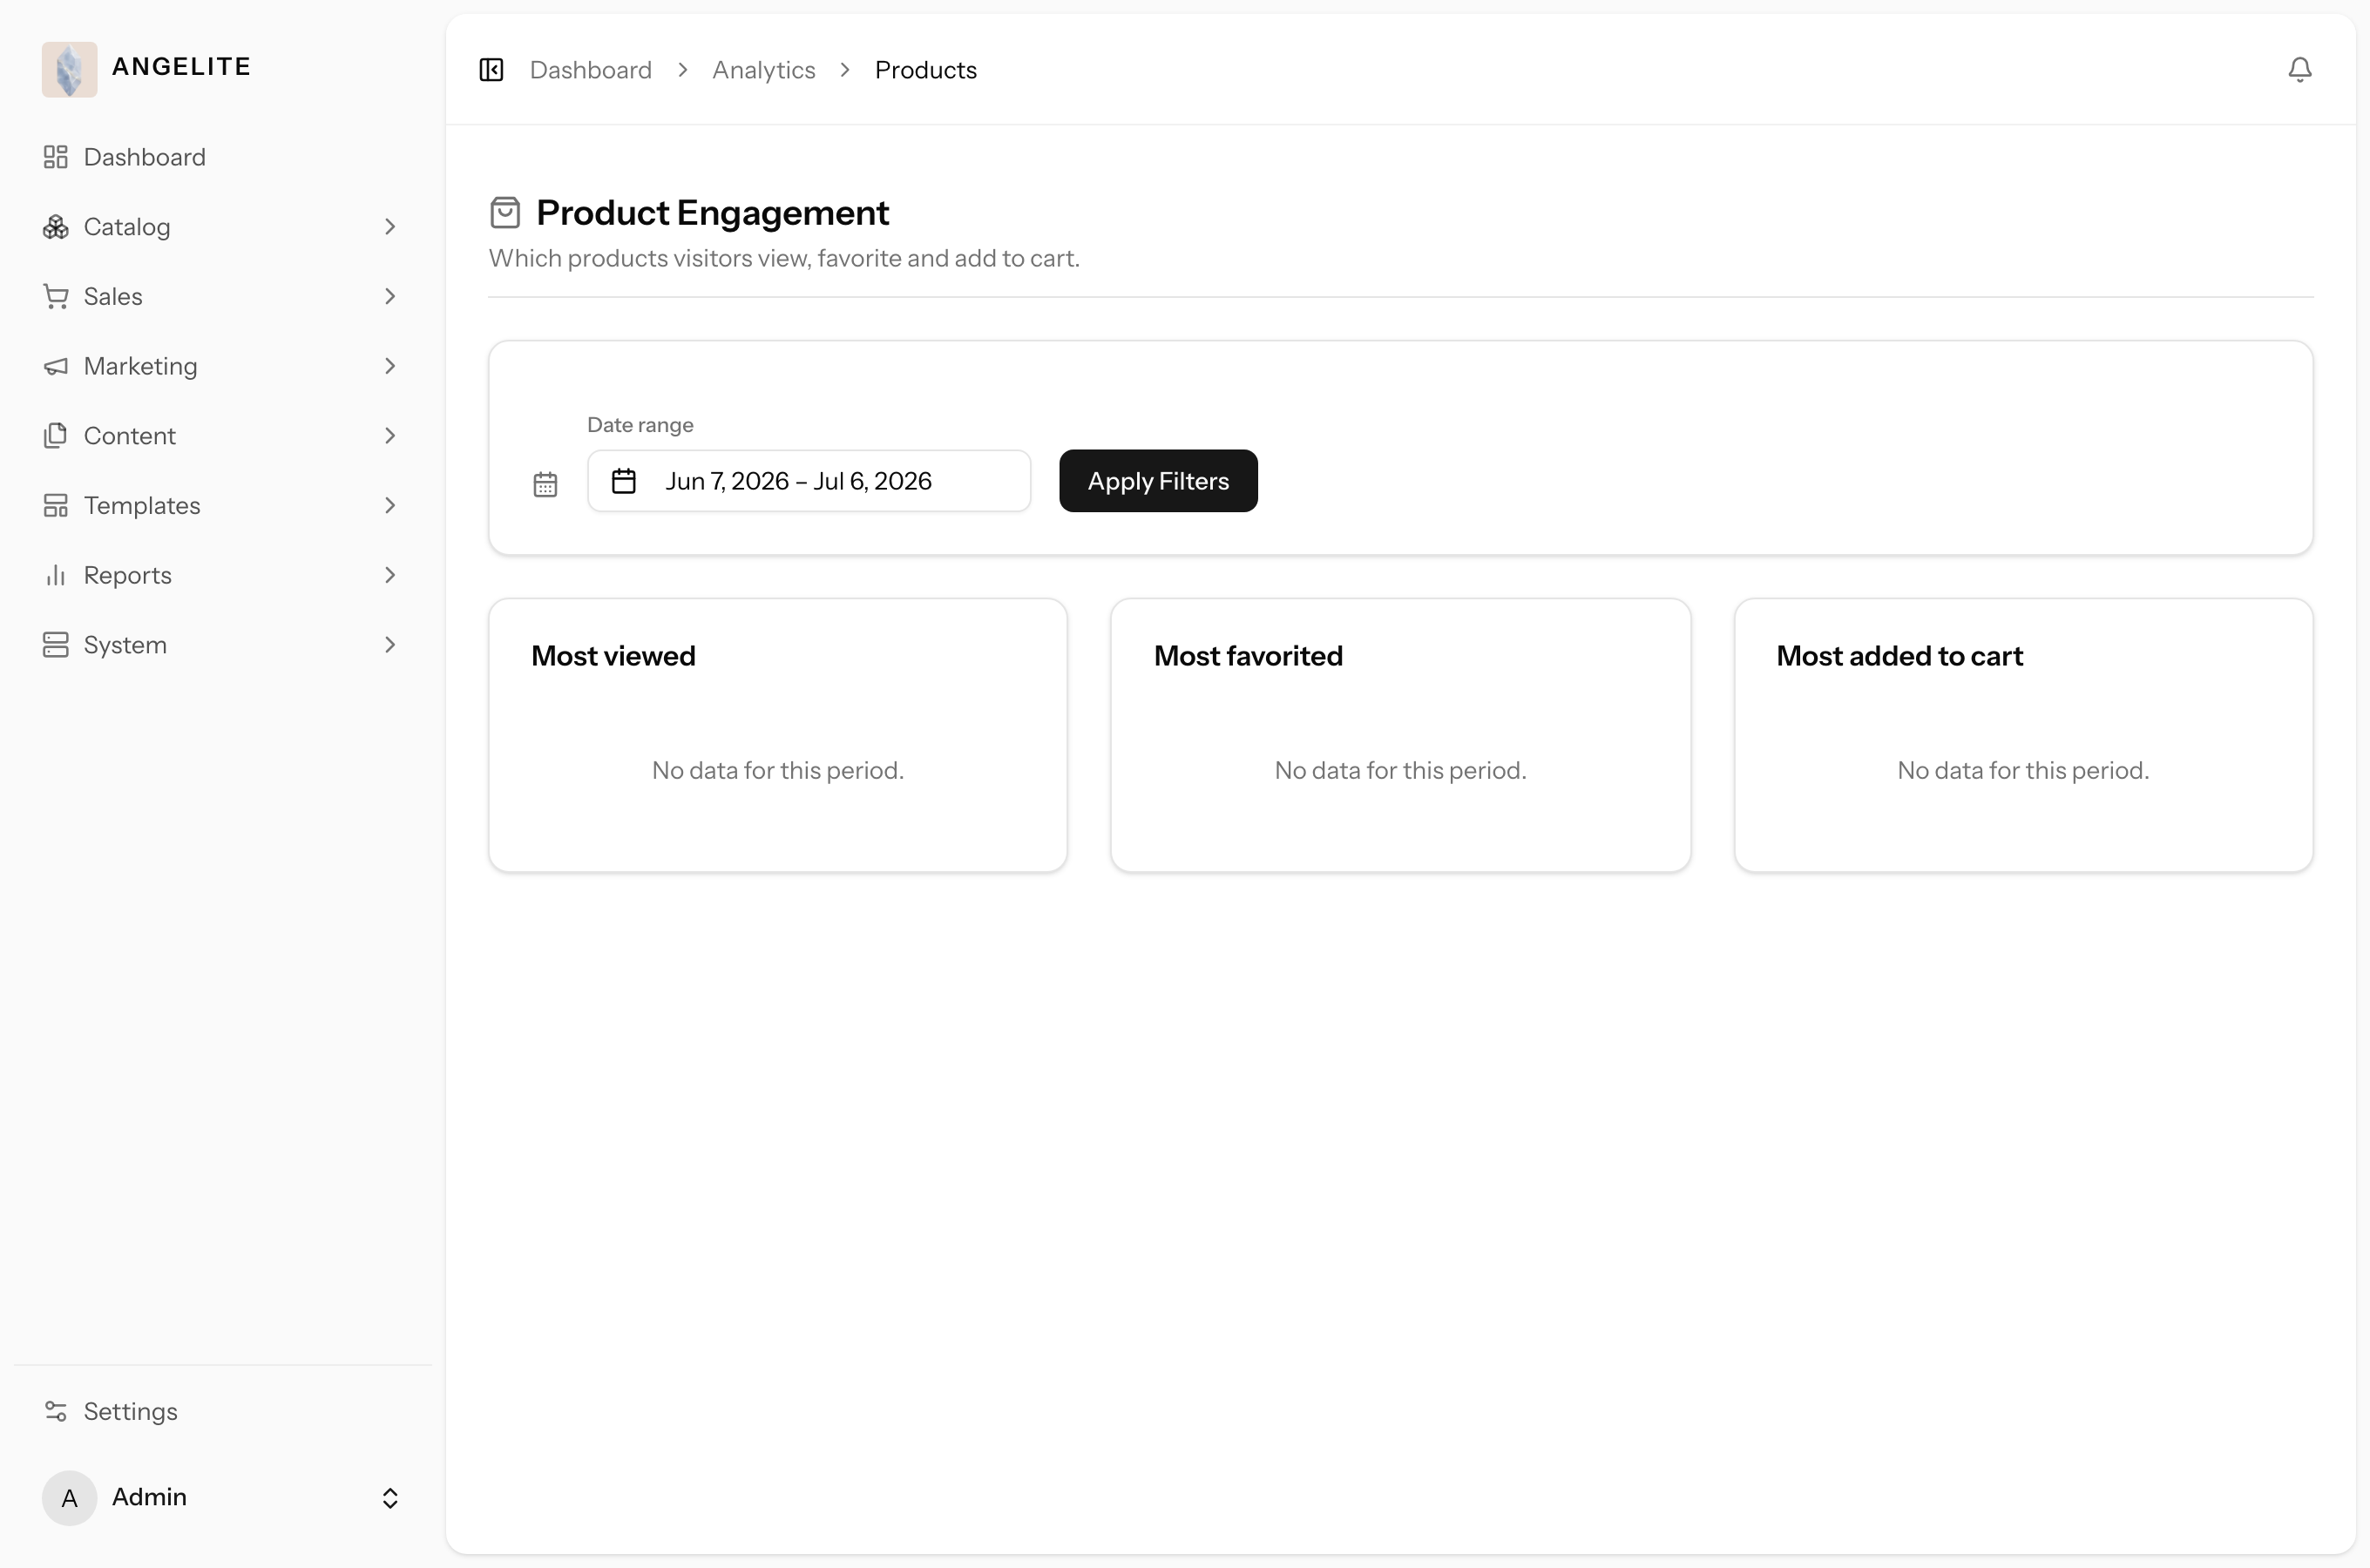
check where most of them came from and which device they browsed on, and look at which products drew
the most views. The funnel view shows how many of those product views turned into an actual sale, so
you can judge whether the push was worth repeating.
How to use it
Switch on Analytics under Settings → Features; it is off by default, and nothing is recorded until you turn it on.
Open Analytics in the admin sidebar.
Set a date range and read visits, unique visitors, top pages and products, and the browse-to-purchase funnel.
Download any breakdown as CSV or Excel if you want to take it further.
Where: Analytics in the admin sidebar.Where: the products view inside Analytics: which products get seen, and which get bought.
Good to know: when this module is off, recording stops entirely and no
visitor data is captured at all; there is nothing to opt out of retroactively.
Ask in plain language
Ask Your Store
AdminOptional · AI Assistant
The problem: the answer exists somewhere in the reports, but
standing in the shop between customers you have neither the time nor the patience to remember which
report and which filter would surface it.
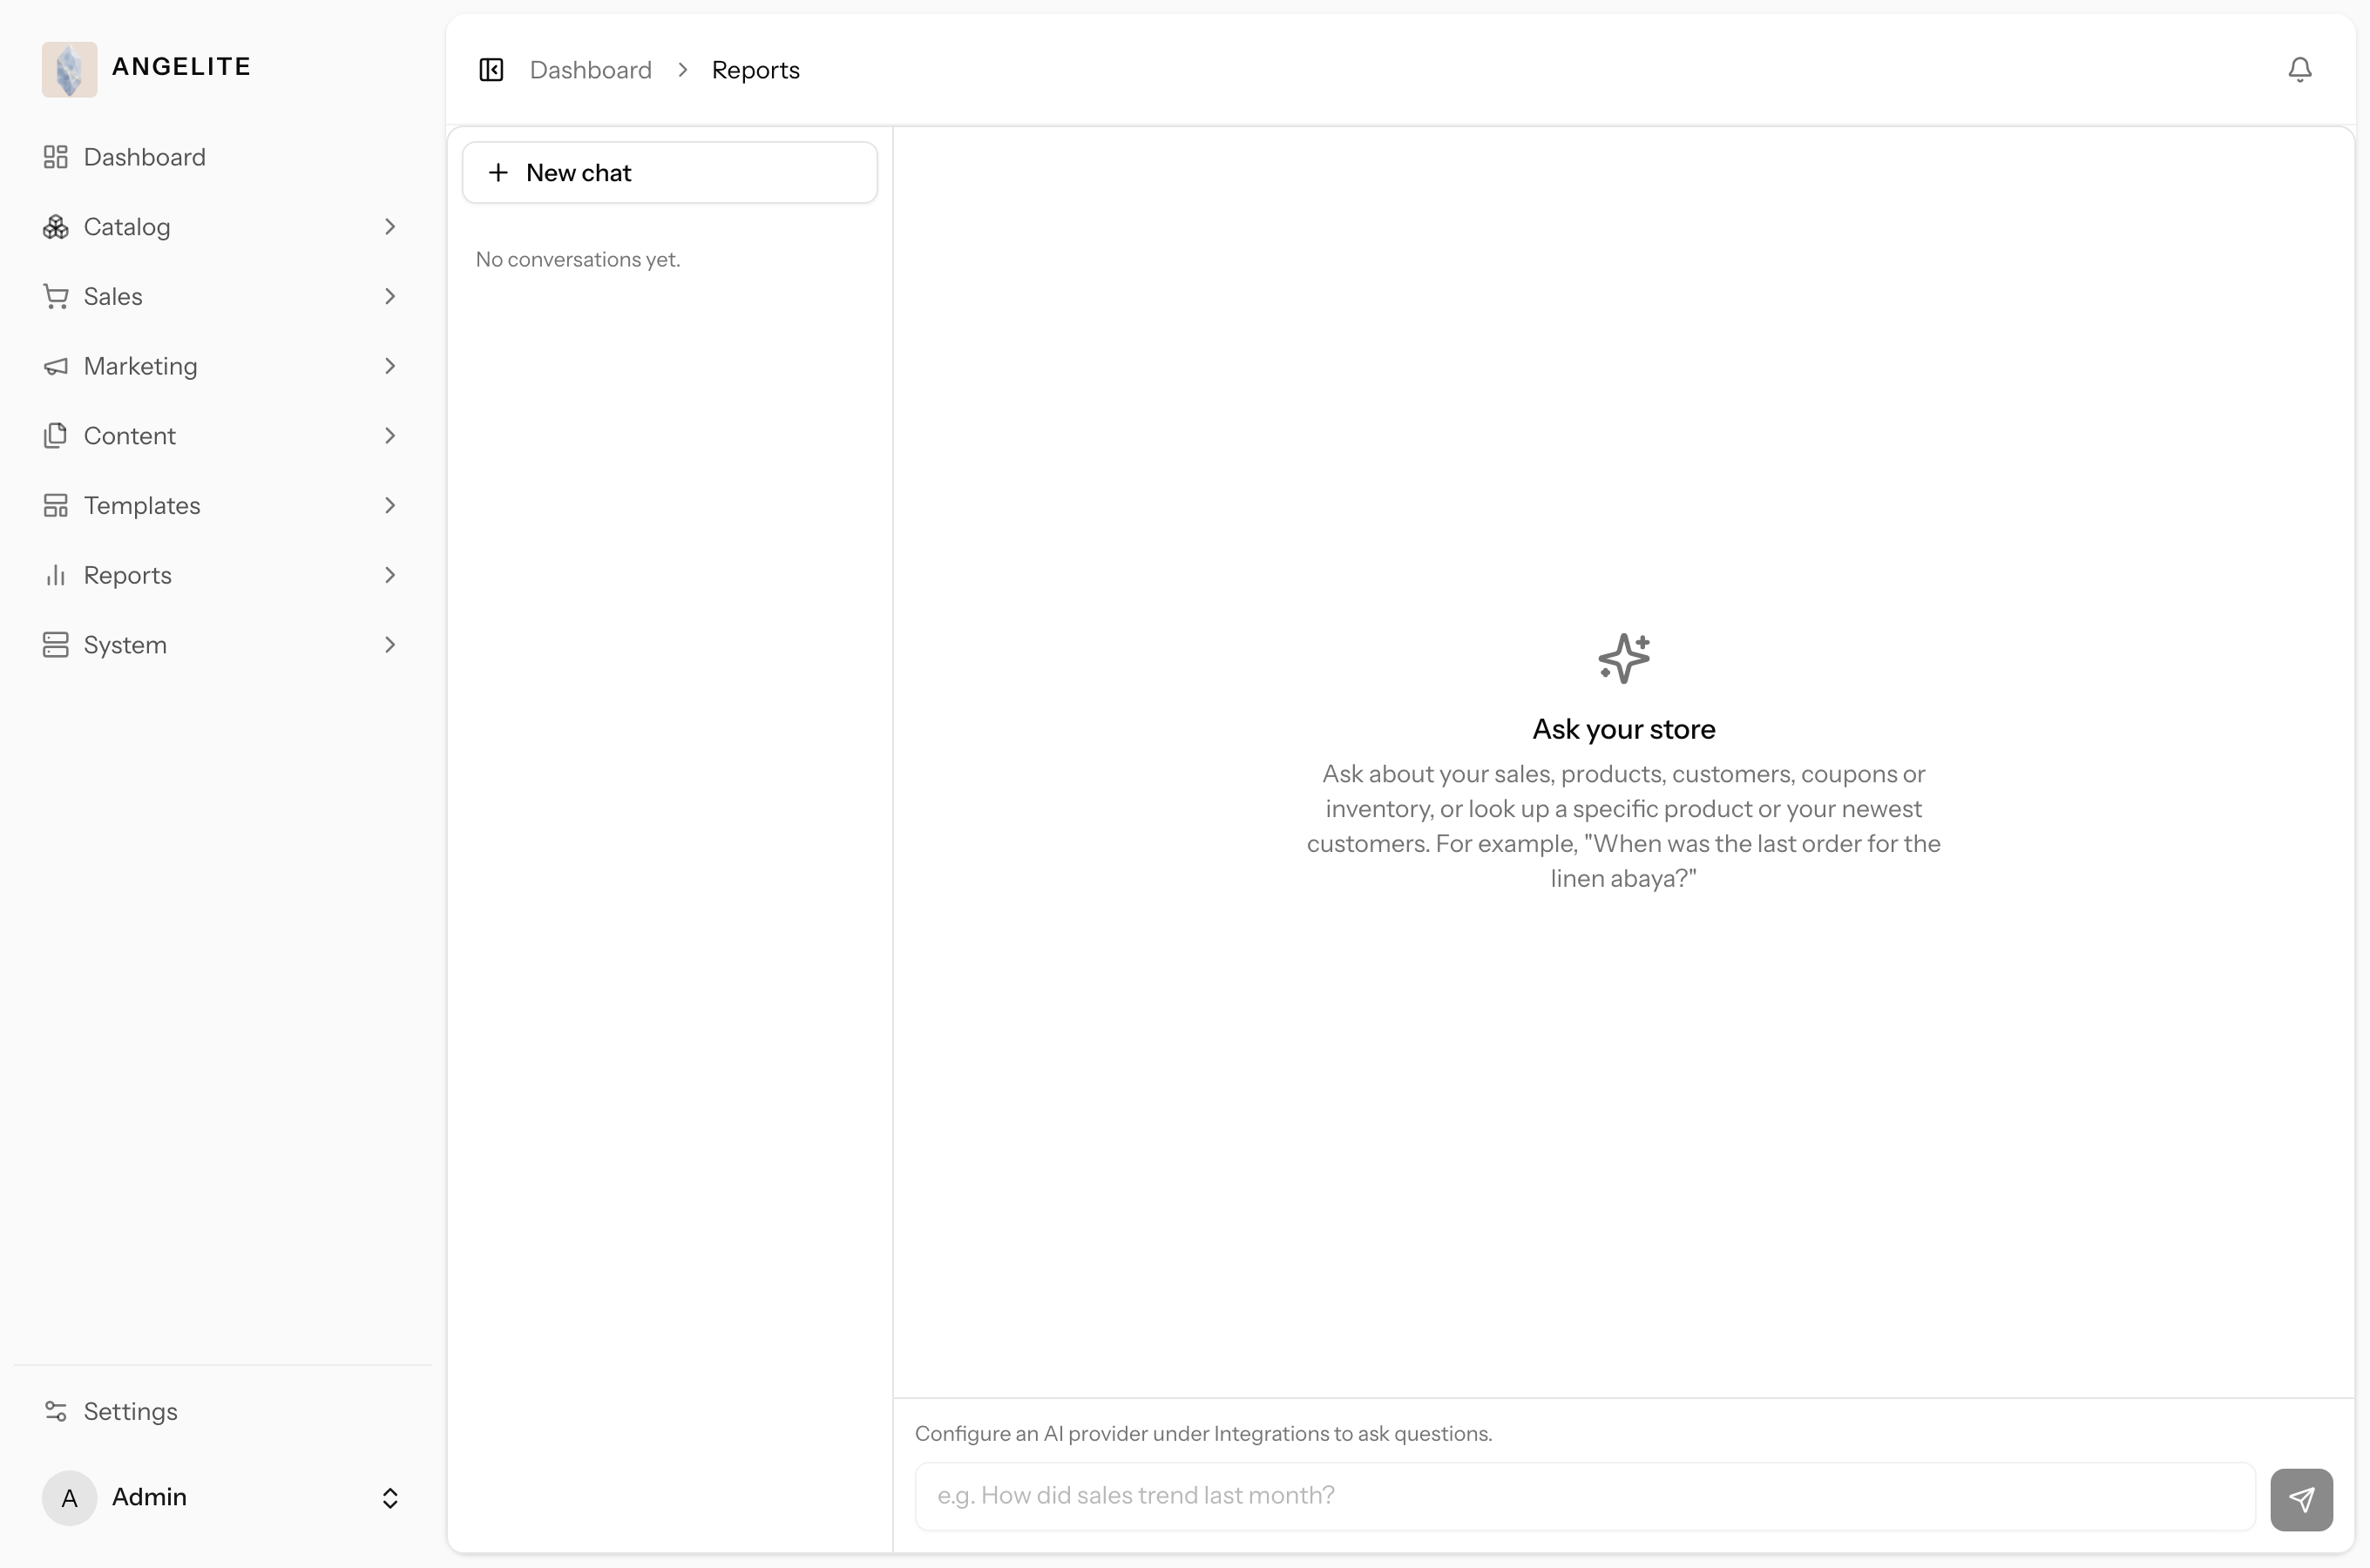
Ask questions about your store in everyday language, like "how did sales do last week?"
or "who are my most valuable customers?", and get a short, clear answer with the supporting figures.
It reads only your trusted reports, and it can never change anything.
In practice
Say you are standing in the shop between customers and a quick question pops into your head: "how did sales do last week?" You do not want to hunt through menus or remember which report holds the answer.
How Angelite handles it: you open Reports → Ask Your Store and type the question just as you thought it. Back comes a short written summary with a table of the supporting figures beneath, and you can keep asking follow-ups, like "who are my most valuable customers?", in the same chat. The assistant draws only from your trusted reports and a few safe lookups; it reads, it never writes, so it can never alter an order or a record.
How to use it
Make sure the AI assistant is set up under Settings → Features and Integrations.
Open Reports → Ask Your Store.
Type your question in plain language and send it.
Read the written summary and the table of figures beneath it; ask follow-up questions in the same chat.
Where: Reports → Ask Your Store.
Safe by design: the assistant draws its answers only from your existing
reports and a few safe lookups. It reads, it never writes, so it can never alter an order or a record.